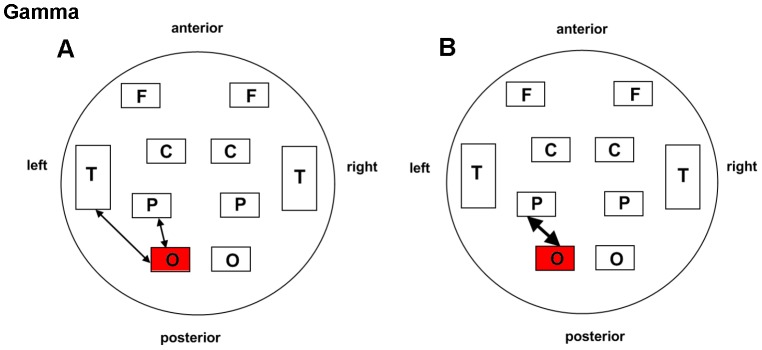
Figure 5. Schematic illustration of BLP correlation alterations for the gamma band.
A. ST36 group. B. NAP group. Lines correspond to significant changes for the average Band-Limited Power (BLP) correlation induced by acupuncture and squares to significant change in the local BLP correlation (red: local increase in the BLP correlation following acupuncture; thin line: P<0.05; thick line: P<0.01; significance is based upon a paired t-test).

