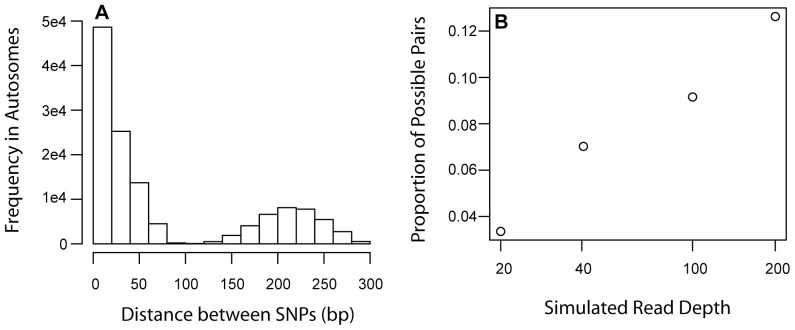
Figure 2. Identification of SNP pairs.
A) The distance between component SNPs of a SNP pair are bimodally distributed, reflecting the frequency of pairs that fall within a single read or across paired end reads. B) Increasing the read depth increased the proportion of pairs it was possible to locate in the pooled paired-end read data with a 0.01 allele frequency cutoff. This proportion of estimable pairs is calculated by counting the number of SNPs in a moving window of length 300 bp and using that to compute the number of possible SNP pairings (n choose 2). This is then compared to the number of SNP pairs identified at a given read depth.

