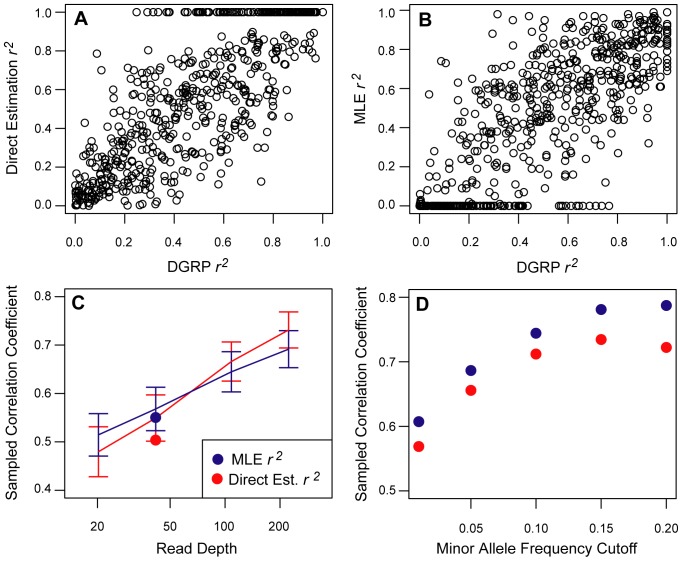
Figure 3. Method performance of LDx in predicting linkage.
r2 measured from the DGRP haplotypes is strongly correlated with estimates from A) the direct observation method and B) the maximum likelihood method. In A), observing only a sparse sampling of the haplotypes creates the overabundance of observed r2 estimates of 1. We determined the correlation between our r2 estimates and r2 values derived from haplotype data provided by the DGRP (Mackay et al 2012). We restricted the DGRP dataset to those strains present within our sample (92 of 162 strains). C) Increasing the simulated read depth increased the correlation between the true r2 and the r2 estimated by the direct observation (red) and maximum likelihood (blue) methods. Estimates in these figures have minor allele frequency cutoff of 1%. D ) Filtering based on minor allele frequency leads to more accurate r2 estimates for the direct observation (red) and maximum likelihood (blue) methods. Points represent r2 estimates made from pooled resequencing of the DGRP.

