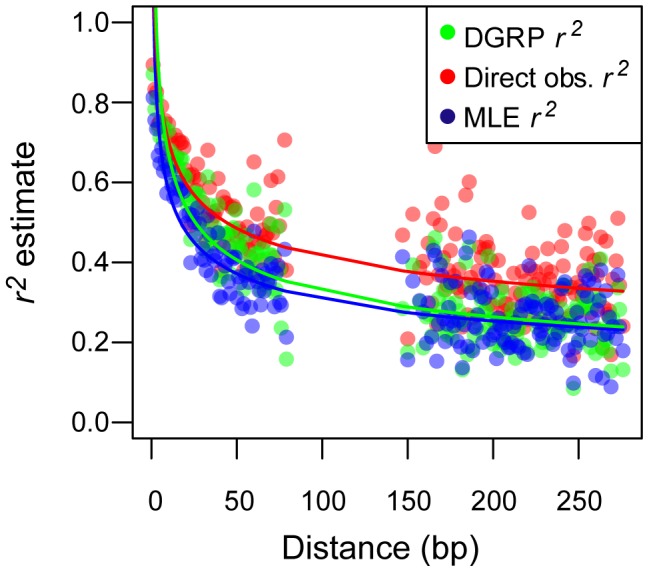
Figure 4. LDx predictions decay at a biologically plausible rate.

r2 decays in a similar pattern among the direct estimation (red), maximum likelihood (blue) and DGRP (green) r2 measures. Points represent average r2 within distance classes. Averages were applied only to pairs that had minor allele frequency >0.1. Lines represent predicted decay or r2 with physical distance. Decay models were fit in R 2.13 (R core Development Team 2012).
