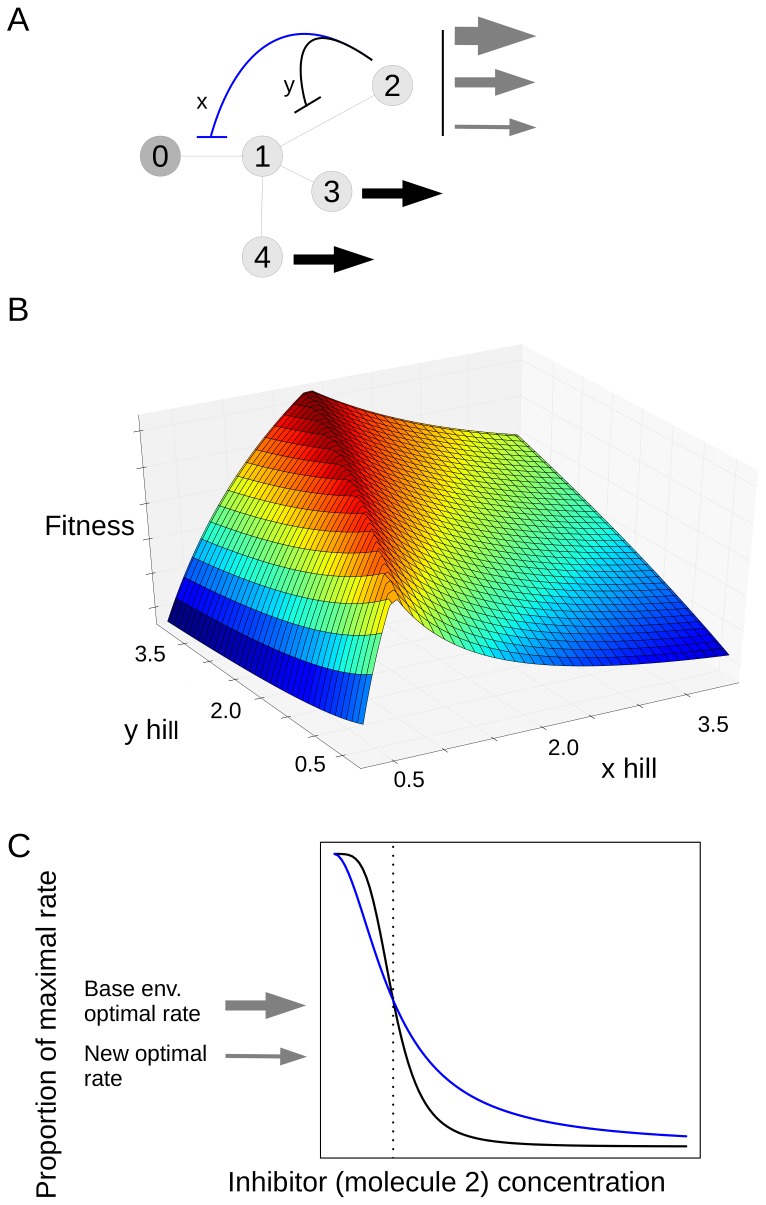
Figure 3. A branching network where the best fitness is not given by the maximum Hill coefficient.
A. Illustration of the network. Molecules 3 and 4 have constant rate outflows which do not vary in different environments, shown with black arrows. B. A fitness landscape for this network. The x and y axes give Hill coefficient for inhibition of the x and y reactions. The z axis is fitness, which reflects the deviations of molecules from their targets and is in units of concentration (see text for definition). C. Plot of the activity of the enzyme vs. concentration of the inhibitor (molecule 2).

