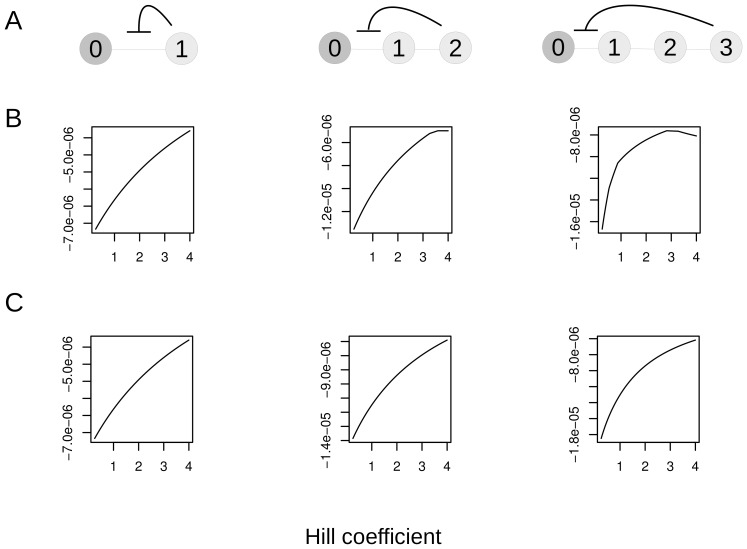
Figure 4. Several longer pathways where the best fitness is not given with the maximum Hill coefficient.
A. Pathways with 2, 3 and 4 molecules. B. Plots of fitness vs. Hill coefficient of inhibitor binding given homeostasis on all molecules. C. Fitness vs. Hill coefficient given homeostasis acting only on the tip molecule. Fitness reflects the deviations of molecules from their targets and is in units of concentration (see text for definition).

