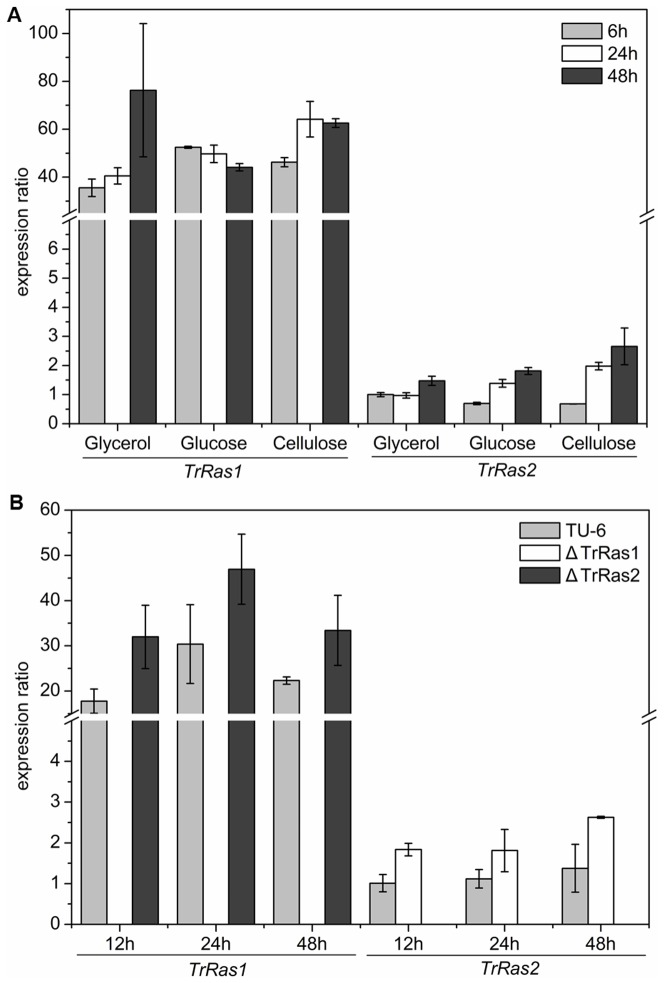
Figure 2. Analysis of transcript levels of TrRas1 and TrRas2 mRNA by qRT-PCR.
(A) Transcript abundances of TrRas1 and TrRas2 on different carbon sources. The ratios of the expression of TrRas1 and TrRas2 to that of the actin reference gene were calculated in T. reesei QM9414 cultured on glycerol, glucose or cellulose. The relative mRNA levels were presented by setting the amount of TrRas2 mRNA detected on glucose at 6 h as 1. (B) Quantitative real-time PCR analysis of TrRas1 or TrRas2 mRNA levels in the ΔTrRas2 or ΔTrRas1 mutant. The ratios of the expression of TrRas1 and TrRas2 to that of the actin reference gene were calculated. The relative mRNA levels were presented by setting the amount of TrRas2 mRNA in T. reesei TU-6 detected at 12 h as 1. Values are means of three independent experiments. Error bars represent standard deviations.

