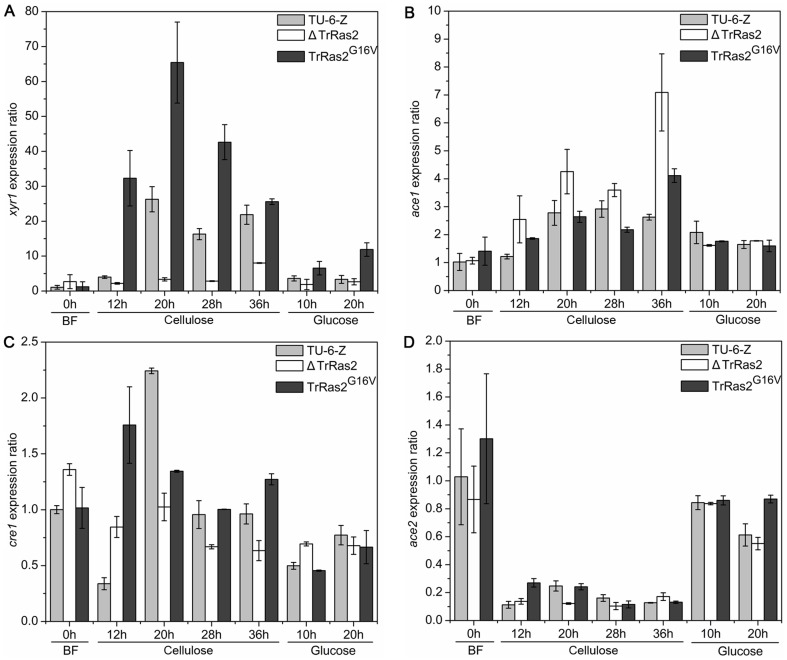
Figure 7. Analysis of the influence of TrRas2 on expression of the transcription factors encoding genes.
Relative expression of xyr1 (A), ace1 (B), cre1 (C) and ace2 (D) from the parental strain TU-6-Z, the ΔTrRas2 strain and the PAnigpdA-TrRas2G16V strain were shown. Transcripts of the target genes were detected just before inducing (BF, 0 h) and 12 h, 20 h, 28 h, 36 h, 44 h after the beginning of the cultivation on cellulose and 10 h, 20 h on glucose. The ratio obtained from BF was set to 1.

