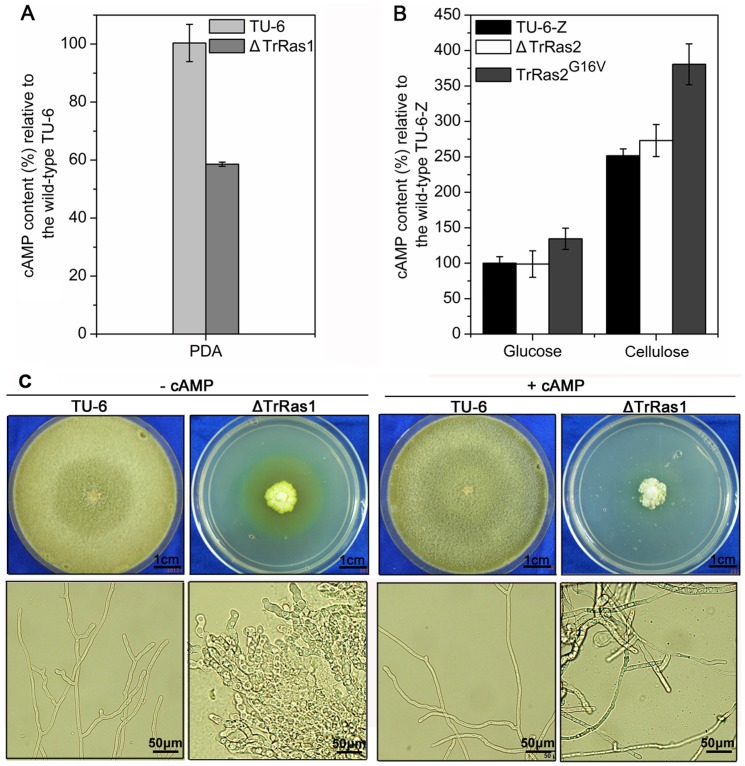
Figure 9. TrRas1 and TrRas2 play similar roles in increasing cAMP content.
(A) The cAMP levels of TU-6 and ΔTrRas1 on PDA plates. (B) Comparison of the cAMP levels of strains TU-6-Z, ΔTrRas2 and PAnigpdA-TrRas2G16V. Cultivation of respective strains and cAMP level determination were performed as described in the methods. The cAMP content is given in relation to parental strain.(C) Phenotypes of wild-type and ΔTrRas1 upon growth on PDA plates in the presence or absence of 2 mM cAMP in the medium. Strains were grown for 7 days at 30°C. Scale bars are shown in the figure.

