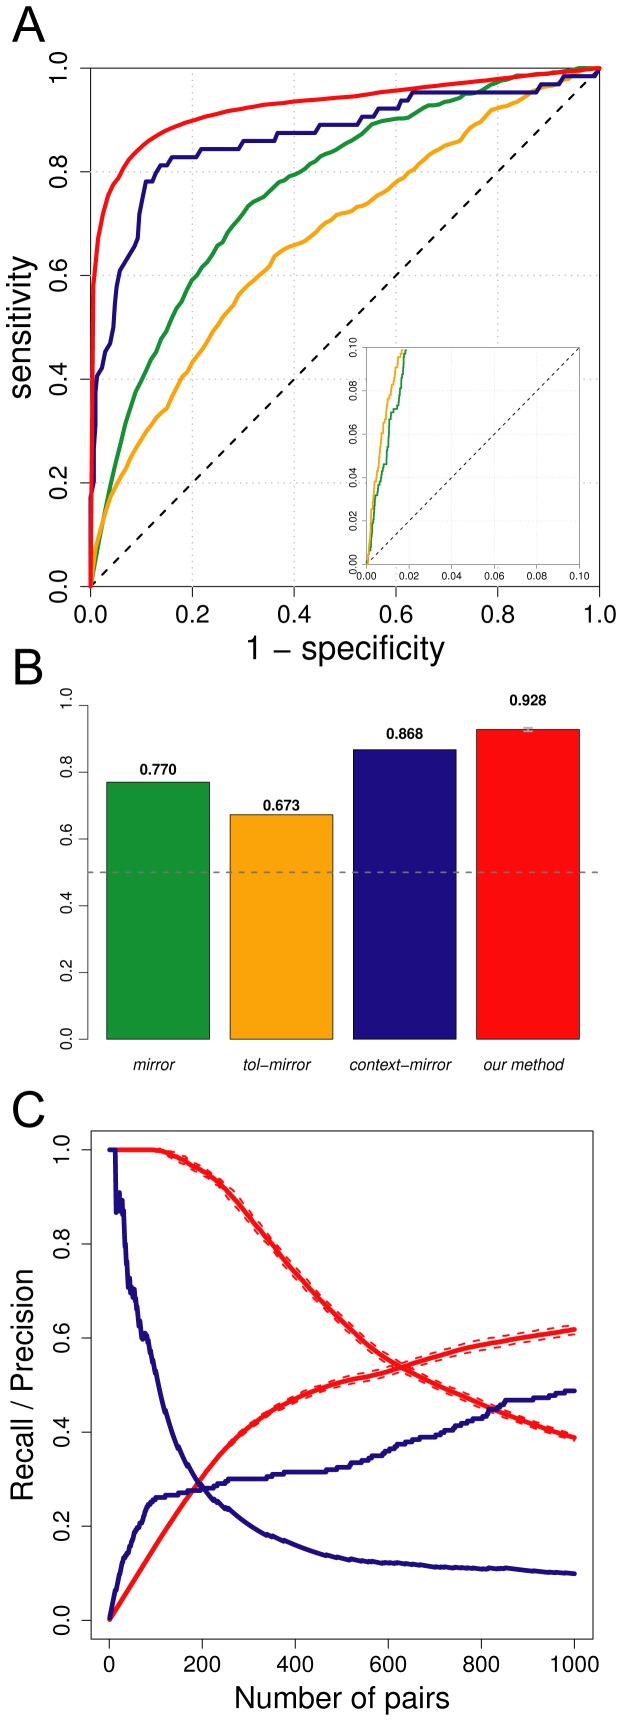
Figure 1. Evaluation of the efficiency of the PPI detection method proposed here.
A. ROC curves of the four methods compared. Green: mirror; Orange: tol-mirror; Blue: context-mirror; Red: our method. The ROC curve plotted for our method is the mean of all 30 independent ROC curves obtained. A zoom of the beginning of the ROC curve is provided in the right-bottom corner. B. AUC values for the four methods compared. Numbers on top of each bar are the exact AUC values. The dashed gray line represents the expected AUC for a method not doing better than random. The error on the last bar represents the standard deviation over the 30 repetitions of our method. Colours are the same as in A. C. Comparison of the precision and recall curves for the context-mirror method (blue lines) and the method we propose here (red lines). The dashed lines on the curves for our method represent the standard deviation over the 30 repetitions. Only the first 1000 pairs are represented.

