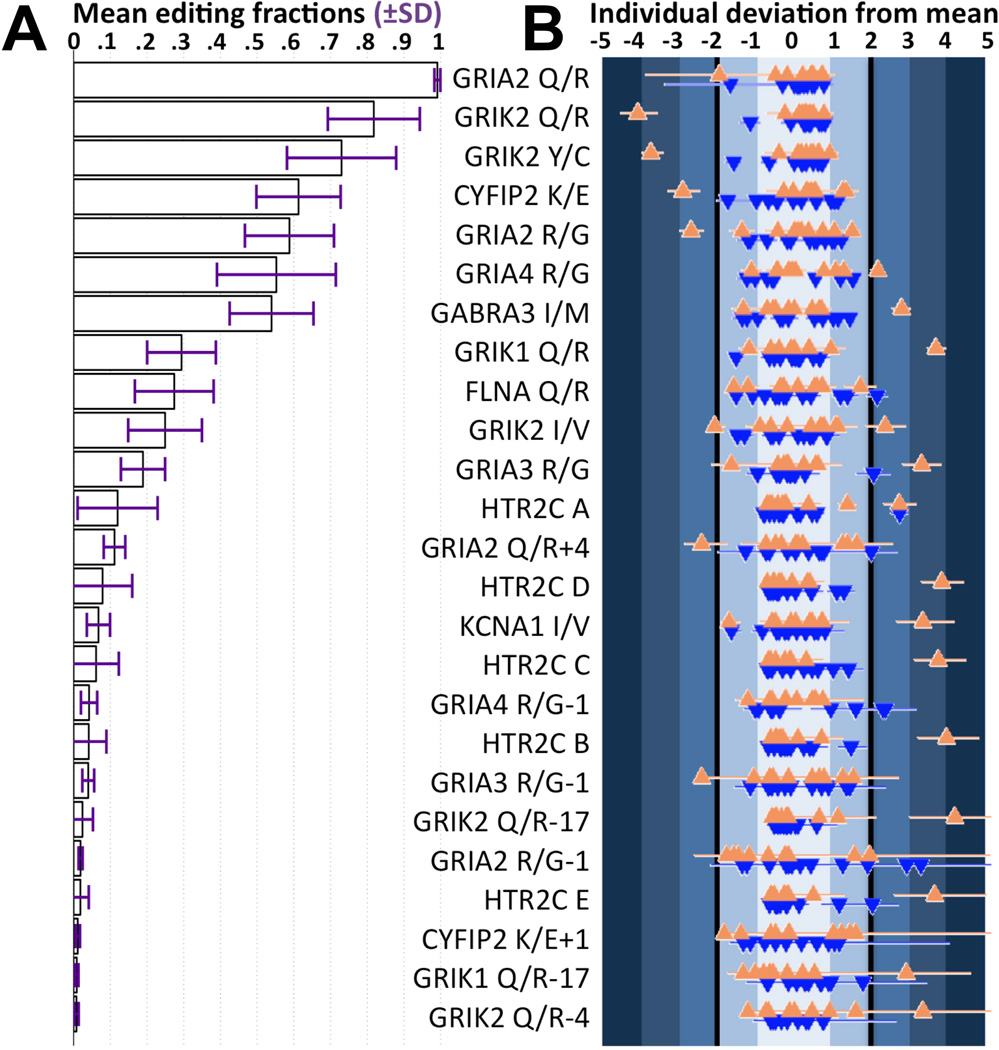
Figure 1.
Individuals with ASD at the extremes of the population editing distributions in 20 of 25 sites. (A) High dynamic range of mean editing across sites, from 99.6% to below detection limit. Standard deviation bars, shown in purple, indicate the large variability in neurodevelopmentally-regulated editing among carefully matched individuals. (B) The individual standardized deviations from the mean editing level across all sites show that the extreme of the population editing distributions tend to be individuals with ASD (orange triangles), and they are the major contributor to the large variability shown in (A). Horizontal lines denote the standardized 95% confidence interval of an individual’s posterior editing distribution. Synaptic editing levels at least two standard deviations away from the mean are highly informative of ASD, with a positive predictive value of 78%.

