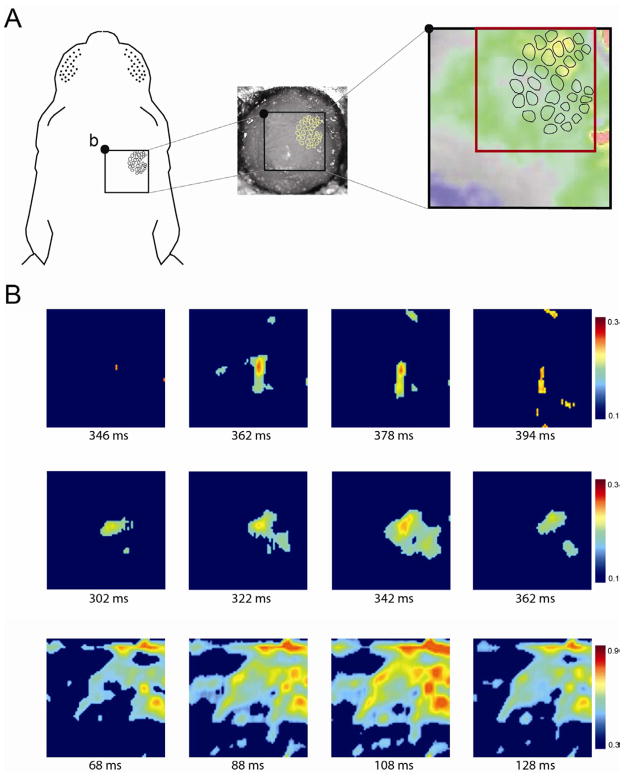
Figure 4.
Voltage-sensitive dye (VSD) imaging of barrel cortex activity during active sleep in 4-day-old rats. (A) The experimental set-up for VSD imaging, highlighting the 4 × 4 mm cranial window (black box) to expose the right barrel cortical field. The 2.5 × 2.5 mm region of interest (ROI) is outlined by the red box. b, bregma. See Figure S3 for methods pertaining to the VSDI procedure. (B) Three representative samples of barrel cortex activity, from isolated activity within 1 or 2 barrels (top two rows) to global activity across the barrel field (bottom row). Each image corresponds to the ROI in (A). The number beneath each frame denotes time from the initiation of a nuchal muscle twitch. Color bars at the right of each sequence indicate range of values of dF/F0. For clarity of presentation, obvious instances of noise were removed manually from some VSD images.

