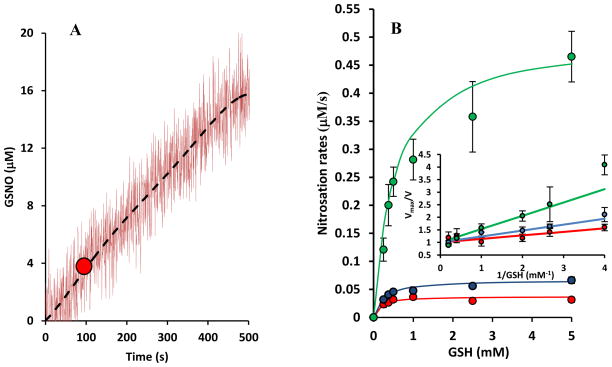
FIGURE 2.
(A) Representative data for GSNO formation as a function of time. GSNO concentration was monitored in a spectrophotometer at 338 nm, following mixing of GSH (250 μM) and PAPA/NO (1 mM). Data were fitted by a 5th order polynomial to remove noise (dashed black line). The maximum slope of the polynomial is identified (red circle) and corresponds to the GSNO formation rate at peak NO concentration. (B) Rates of nitrosation (V) at three different NO donor concentrations (500 μM (red), 1 mM (blue) and 5 mM (green)) are plotted against GSH concentrations. Inset shows Vmax/V plotted against 1/GSH. Slope of these lines indicate EC50 values. An increase in EC50 values is observed with increasing NO donor concentrations.

