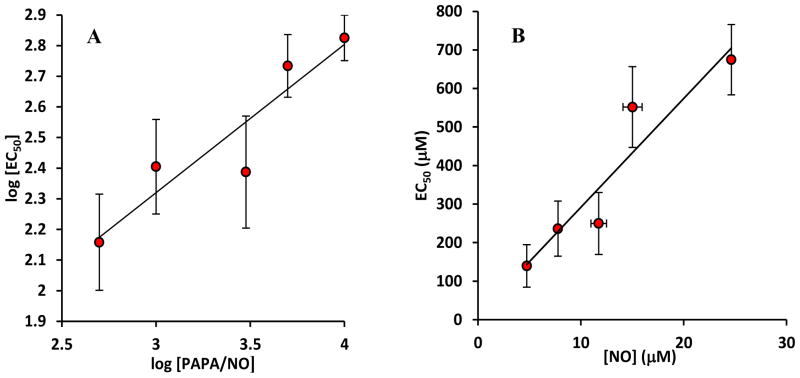
FIGURE 3.
(A) A log – log graph of half maximum constant (EC50) at different PAPA/NO concentrations. Average EC50 values (n = 3) are presented. The slope of 0.5 ± 0.2 is not statistically different from 0.5 (p = 0.946). The result suggests that EC50 is proportional to the square root of NO donor concentration and thus proportional to NO concentration. (B) A graph of EC50 vs. clamped NO values from NO electrode measurements in Fig 1B. The slope from a linear fit of the graph is 30.5 ± 5.2 μM GSH/μM.

