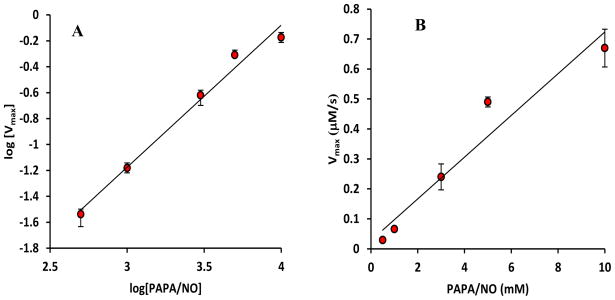
FIGURE 4.
(A) A log – log graph of nitrosation rates at saturating GSH concentrations (Vmax) at different PAPA/NO concentrations. Average values with standard deviations (error bars) are presented. A linear fit gives a slope of 1.08 ± 0.1. The slope is not statistically different from 1 (p = 0.09) and significantly different from 0.5 and 1.5 (p ≪ 0.05) suggesting a Vmax proportional to the NO donor concentration. (B) The linear dependence of Vmax on PAPA/NO concentration has a slope of (7.5 ± 0.5) × 10−5 s−1.

