Abstract
Cell tracking using perfluorocarbon (PFC) labels and fluorine-19 (19F) MRI is a noninvasive approach to visualize and quantify cell populations in vivo. In this study, we investigated three-dimensional (3D) compressed sensing (CS) methods to accelerate 19F MRI data acquisition for cell tracking and evaluate the impact of acceleration on 19F signal quantification. We show that a greater than eight-fold reduction in imaging time was feasible without pronounced image degradation and with minimal impact on the image signal-to-noise ratio (SNR) and 19F quantification accuracy. In 19F phantom studies, we show that apparent feature topology is maintained with CS reconstruction, and false positive signals do not appear in areas devoid of fluorine. We apply the 3D CS 19F MRI methods to quantify the macrophage burden in a localized wounding-inflammation mouse model in vivo; at eight-fold image acceleration the 19F signal distribution was accurately reproduced, with no loss in SNR. Our results demonstrate that 3D CS methods have potential for advancing in vivo 19F cell tracking for a wide range of preclinical and translational applications.
Keywords: cell tracking, perfluorocarbon, 19F MRI, compressed sensing, rapid imaging
Introduction
In vivo MRI cell tracking is emerging as a useful tool for visualizing cell distributions and dynamics in their native environment (1,2). MRI cell tracking is used preclinically for visualizing cellular inflammatory processes and monitoring the delivery and persistence of cell therapies for scientific and regulatory purposes. Moreover, there is momentum towards clinical translation of MRI cell tracking (3,4). To enable MRI cell tracking, intracellular cell labels or contrast agents are commonly employed (5,6). Cell labeling of monocytes/macrophages can be achieved in situ following systemic administration of particulate contrast agents to the subject (7–10). Alternatively, labeling of a particular cell type can be achieved by ex vivo co-incubation of selected cells with a labeling agent, followed by cell administration to the subject (5,10–13). Numerous studies have reported MRI detection of labeled cells using superparamagnetic agents with high sensitivity (5,13). However, challenges exists interpreting the 1H contrast imposed by these agents against intrinsic tissue contrast, and cell quantification in vivo is difficult (14).
The use of perfluorocarbon (PFC) emulsion cellular imaging agents, in conjunction with 19F MRI detection, is an emerging approach for cell tracking (15). This approach has the advantage of high cell detection specificity with no background signal. PFC agents have been used for in situ tagging of inflammatory macrophages (7–10), and ex vivo cell labeling of dendritic cells (16,17), T-cells (12,18) and stem cells (19,20). PFC has also been incorporated into targeted imaging agents (21). The 19F nucleus is spin-1/2 and has a gyromagnetic ratio that differs from 1H by only 6% (6,15). PFC molecules, typically formulated as emulsions, are chemically stable in vivo, and have minimal effects on cell function and proliferation. Different PFC molecules have different 19F chemical shifts, thereby enabling simultaneous labeling and tracking of multiple cell types (20). Moreover, signal quantification is straightforward in spin density-weighted images enabling ‘in vivo cytometry’ (12) and inflammation quantification (10).
In cell tracking applications, the 19F images are often in the low signal-to-noise ratio (SNR) regime (e.g., SNR<10) due to probe sparsity. In certain applications, significant signal averaging and long data acquisition times are employed to boost SNR, and this may limit the usefulness of 19F cell tracking in certain applications.
Recently, compressed sensing (CS) has been adapted from information theory as a generalizable tool to significantly reduce MRI acquisition time (22). The detailed theory of CS is described elsewhere (22–24). By exploiting the sparsity of objects to be imaged in a transformed domain, a small subset of conventional k-space measurements can be made to reconstruct the objects non-linearly. The artifacts caused by pseudo-randomized undersampling appear as incoherent noise. CS methods are particularly well-suited for 19F cell tracking studies as the image data often display isolated, punctate signal distributions against a pure noise background in the image field of view, and thus the condition of image sparsity is rigorously obeyed. Previously, CS has been used for a variety of MRI applications including dynamic imaging (25), T1/T2 mapping (26), angiography (27), and chemical shift imaging (28). Studies of 19F MRI utilizing CS has been reported in the context of chemical shift imaging and catheter tracking(29,30).
With an eye towards cell tracking applications, we investigated 3D CS methods for accelerated 19F MRI. The effect of CS acceleration factor (AF), i.e., the degree of k-space undersampling, on 19F signal quantification was evaluated by comparing the spin-density weighted signal intensity of CS-reconstructed images to conventional fast imaging methods. To further evaluate the 3D CS method, in vivo 19F imaging of inflammation in a skin-wound mouse model was performed. After in situ labeling of macrophages by intravenous injection of PFC emulsion, the 19F signal in macrophages was reconstructed and quantified. Overall, our results demonstrate that a significant improvement in the image signal-to-noise ratio (SNR) per image acquisition time (t) is feasible. Three-dimensional CS methods have potential for advancing in vivo 19F MRI cell tracking, particularly for future clinical applications where short imaging times are essential for practical implementation.
Materials and methods
19F phantom
A 19F phantom was prepared by filling eight borosilicate glass micro-pipet capillaries of different diameters with neat PFC oil (perfluoro-15-crown-5-ether, Exfluor, Inc., Round Rock, TX). The capillaries were sealed at both ends, arranged parallel around a 2 cm diameter, and embedded in a 50 ml conical tube containing 2% agarose in H2O. Capillary inner diameters (D) were 1.83, 1.38, 1.13, 0.92, 0.70, 0.58, 0.43, and 0.29 mm. The fluorine signal in an axial image through the capillaries is proportional to the cross sectional area of each tube, thus the integrated 19F signal in these capillaries is proportional to π(D/2)2.
Simulated CS studies on 19F phantom
Fluorine-19 phantom images were acquired with a 7 T Bruker Avance AV3 horizontal-bore system (Bruker Biospin, Billerica, MA) using a 3D fast low-angle single-shot (FLASH) sequence. A volume resonator was used that could be tuned-matched to either 19F or 1H. Imaging parameters were: TE/TR=7/190 ms, flip angle=60°, number of averages (NA) =8, field of view (FOV) =4×4 cm2, matrix size=128×128, and slice thicknesses of 1 and 0.5 mm where acquired.
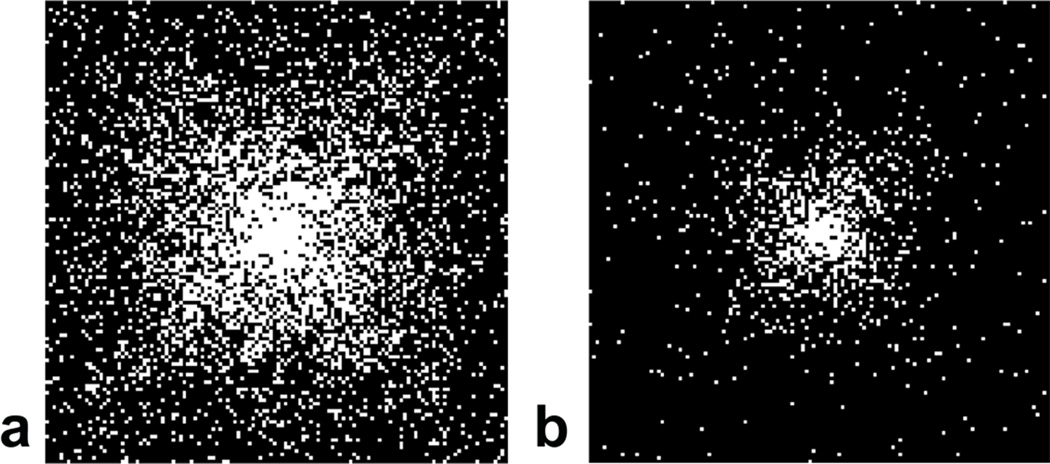
To simulate CS acquisitions, raw k-space FLASH data were undersampled offline in the two phase encoding directions using the SparseMRI software package (22) in MATLAB (MathWorks, Inc., Natick, MA). Data with AF equal to 2, 4, 8, 16, and 32 were generated using offline sampling patterns with a polynomial power (p) that increased monotonically with AF (p=5 for AF=2 to p=10 for AF=32). Representative CS sampling patterns are shown in Fig. 1. The generated sampling pattern was pseudo-random, with variable density to avoid the spatially coherent artifacts that occur with uniform undersampling (22). The patterns emphasize the center of k-space, while also sampling the outer edges of k-space.
Fig. 1.
Pseudo-random CS undersampling schemes emphasizing the k-space center. Panel (a) shows AF=4 and panel (b) shows AF=16, where AF is acceleration factor. White pixels represent lines that are sampled, while black represents unsampled k-space. Undersampling occurs in the two phase encoding directions along the horizontal and vertical axes (matrix size 128×128), while in the readout direction (into the page), the k-space remains fully sampled.
3D CS MRI of 19F phantom
Phantom images were also acquired using CS k-space sampling. 3D CS rapid acquisition with relaxation enhancement (RARE) images were acquired using a 11.7 T Bruker Avance AV2 vertical bore scanner with a volume resonator that could be tuned-matched to either 19F or 1H. For CS acquisitions, an in-house RARE pulse sequence was developed incorporating a predetermined phase encoding gradient table yielding a pseudo-random, non-uniform sampling pattern that emphasized the k-space center (22). Image parameters were: TE/TR=11/100 ms, RARE factor=8, NA=16, FOV=4×4×4 cm3, and matrix size=128×128×128. A variable, passive RF attenuator (Model 839, Kay Elemetrics, Inc., Lincoln Park, NJ) was added in-line at the scanner preamplifier input to systematically achieve three different 19F SNR levels (SNR=8, 14, and 58). At each SNR level, the AF values were 2, 4, 8, 16, and 32, and the other imaging parameters remained constant.
In vivo studies
For in vivo studies, a localized wounding-inflammation mouse model was used. Animal protocols were approved by the Institutional Animal Care and Use Committee of Carnegie Mellon University. A female C57BL/6J mouse (n=1) was anesthetized with ketamine/xylazine cocktail via intraperitoneal injection. An incision of approximately 1.5 cm in length was made in the skin, proximal to the right jugular vein, and then sutured closed. After 24 hours, 0.2 ml of a PFC emulsion (VS-1000H, Celsense, Inc., Pittsburgh, PA) was delivered intravenously via tail vein. This PFC reagent is taken up by macrophages in vivo (8,9), and labeled macrophages accumulate at sites of inflammation resulting in a 19F signal.
After 48 hours, the animal was scanned using 19F 3D CS RARE at 11.7 T (Bruker). Imaging parameters were: TE/TR=11/1000 ms, RARE factor=8, NA=8 or 1, FOV=3.2×3.2×3.2 cm3, and matrix size=64×64×64. Fully sampled and AF=8 data were collected, with the remaining imaging parameters unaltered. The sampling patterns were identical to those in the phantom studies. The total 19F imaging times of the fully sampled and 8-fold undersampled data were 68.3 and 8.5 minutes, respectively. Additionally, 1H images was acquired as an anatomical underlay using a respiratory-gated, spin-echo sequence with parameters: TE/TR=11/700 ms, NA=4, a 3.2×3.2 cm2 FOV, and a matrix size of 256×256, number of slices=64, slice thickness=0.5 mm. A reference capillary with a 10% diluted PFC emulsion in agarose was placed along the animal’s torso in the image FOV.
CS reconstruction and signal quantification
CS images were reconstructed offline using the SparseMRI software package in MATLAB (22). Briefly, reconstruction from a subset of k-space data was performed by finding approximate solutions to the following equation using a nonlinear conjugate gradient descent algorithm with back-tracking line search (22)
| [1] |
where represent the total variation TV-norm and the L1-norm operation, respectively, F is the Fourier encoding matrix, d is the sampled k-space data vector, ρ is the image of interest to be reconstructed, α and β are weighting parameters, ε is the threshold constraint on data consistency, and Dh and Dv represent the differential operators along the horizontal and vertical dimensions, respectively. Functions were called to reconstruct images by specifying a few key parameters that included TV and L1 constraints (α = 2, β = 0.1, ε = 10−6) and 100 iterations of the linear conjugate descent with a back-tracking line search algorithm. The sparsity transform used was the identity transform, since 19F images are sparse in the spatial domain. The typical reconstruction time for a 3D volume of matrix size 64×64×64 was approximately 4 minutes on a PC including manual data loading.
After reconstruction, all phantom images were normalized to the maximum voxel image intensity in the FOV to linearly rescale the image intensity of Bruker raw data from an arbitrarily large scale to the range of [0,1]. Such image normalization may produce a systematic over- or underestimation of the absolute signal intensity, but it will not affect the 19F signal quantification. To quantify 19F signal in the phantom, the total signal intensity in each capillary was calculated, and normalized to the total intensity of the largest capillary. The in vivo 19F signal was normalized to the total intensity of the 10% PFC reference capillary.
The image SNR was estimated using the average signal intensity in an ROI divided by the standard deviation of background noise intensity in a large (>20 voxel) ROI distant from the capillaries. For phantom studies, the signal SNR was calculated for the largest capillary. For the in vivo experiment, the signal ROI was manually traced to include the entire perimeter of the apparent inflammation hot-spot; for the noise calculation, a large ROI was used distant from the rat body.
Results
Simulated CS studies of 19F phantom
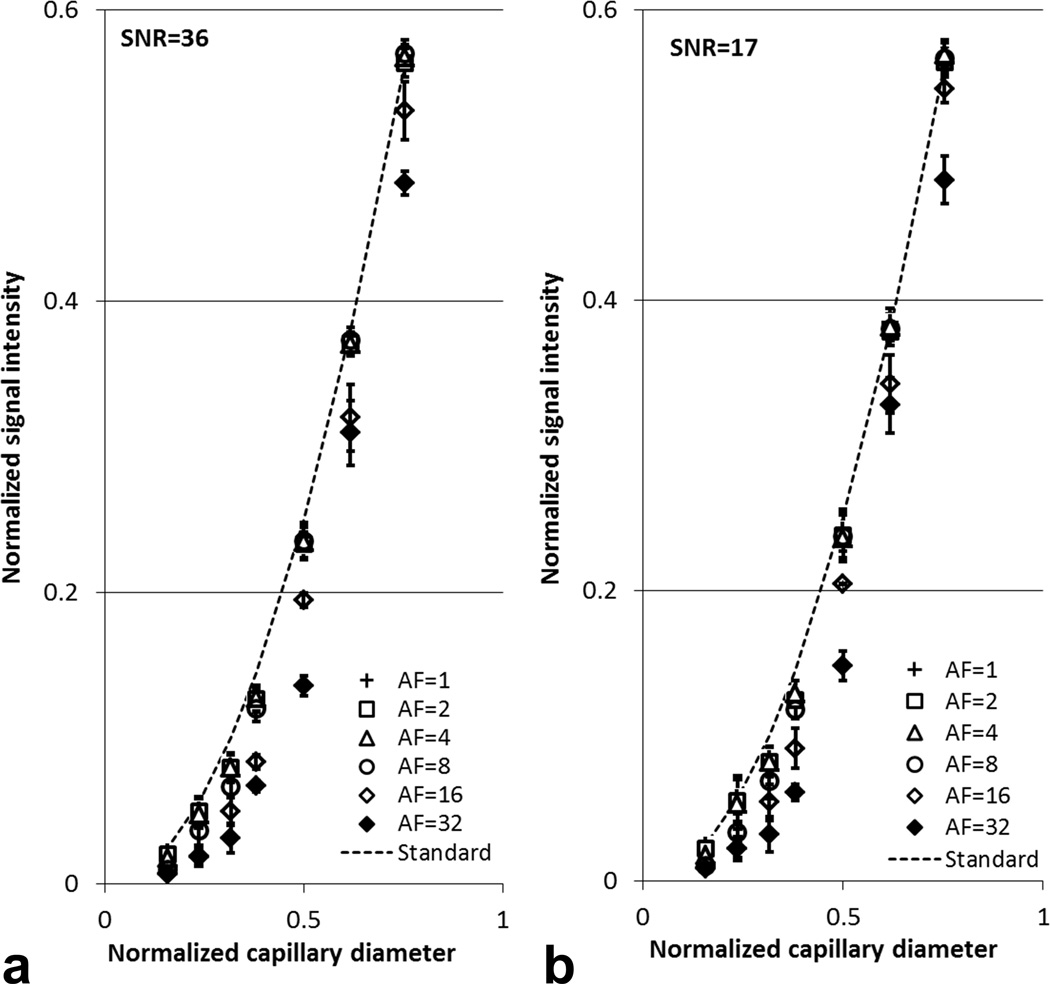
Using a canonical phantom MRI dataset, the full k-space was retrospectively down-sampled to evaluate the impact of CS on reconstructed images and 19F quantification. Two images with different SNR levels were acquired by varying the slice thickness (SNR = 17 and 36). Reconstruction with fully sampled k-space (AF=1) showed good agreement to the calculated standard (Fig. 2). With AF up to 8-fold, the CS-reconstructed 19F signal values were quantitatively comparable to the theoretical standard (Fig. 2). With AF as high as 16 or 32, the simulated CS reconstruction began to underestimate the 19F signal intensity in all capillaries (Fig. 2). Specifically, in the four largest capillaries (>5 voxels), the intensity difference between CS reconstruction and the theoretical standard was within ±10%. In the three smallest capillaries, containing significant partial-volume voxel content (voxel sizes ranging from approximately 5 to < 1), the CS reconstructed signal had a larger estimation error.
Fig. 2.
Quantification results for simulated CS acquisition and reconstruction of 19F phantom data. Conventional FLASH images of 19F phantom with slice thickness of 1 mm (a) and 0.5 mm (b) were reconstructed with full k-space sampling (AF=1) and different acceleration factors (AF= 2, 4, 8, 16, and 32). Here, ‘Standard’ denotes theoretical 19F signal calculated using the cross-sectional area of each capillary normalized to that of the largest capillary. The error bars represent the standard deviation calculated for three slices.
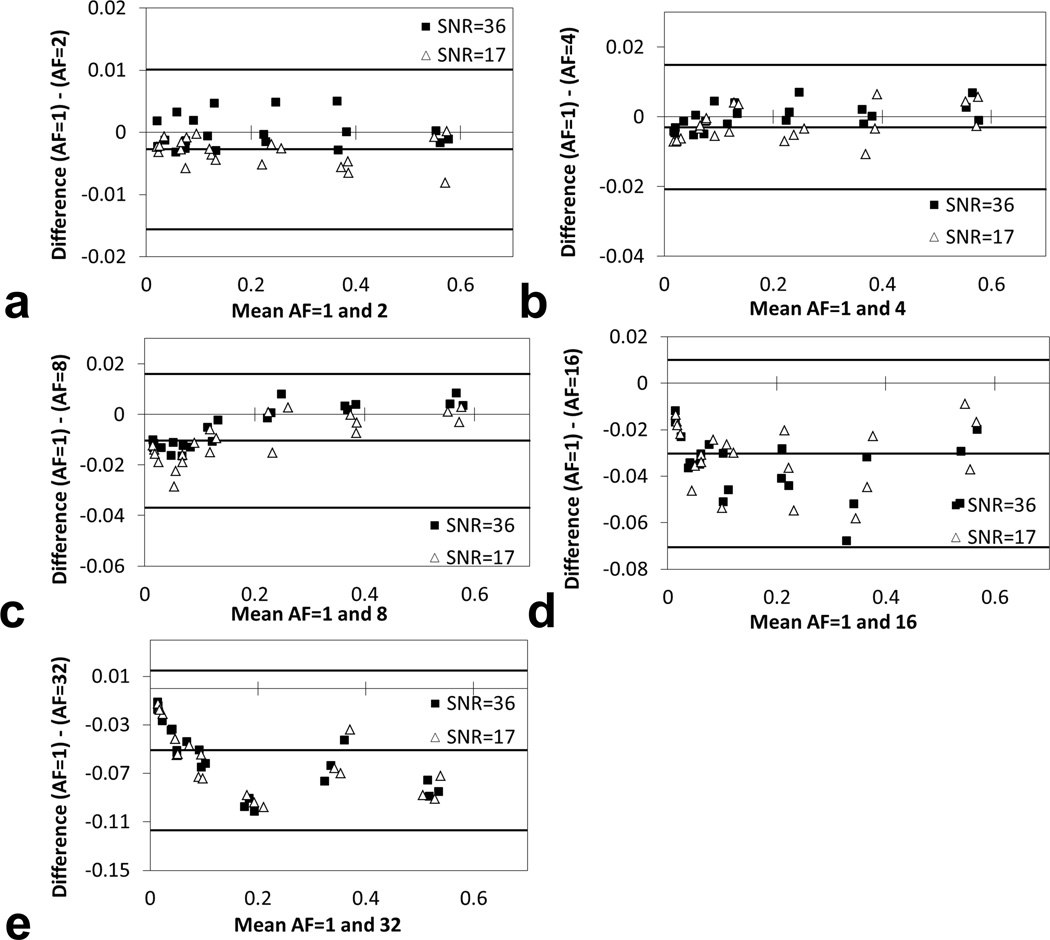
Bland-Altman plots showed that the differences in 19F signal intensity from simulated CS reconstruction and conventional reconstruction (AF=1) were close to zero when AF was less than or equal to 8 (Figs. 3a–c). With AF=16 or 32, the absolute signal differences between CS and conventional reconstruction increased to 0.03 and 0.05, respectively (Figs. 3d–e). The magnitude of background noise seemed to have minimal impact on the quantitative analysis in our simulated reconstruction when SNR was 17 or 36 (Figs. 2–3).
Fig. 3.
Bland-Altman plots showing difference between reconstructed 19F signal using full k-space sampling and simulated CS with undersampling. FLASH images with slice thickness of 1 mm (SNR=36) and 0.5 mm (SNR=17) were reconstructed with full k-space sampling (AF=1) and various acceleration factors (AF= 2, 4, 8, 16, and 32).
3D CS RARE studies of 19F phantom
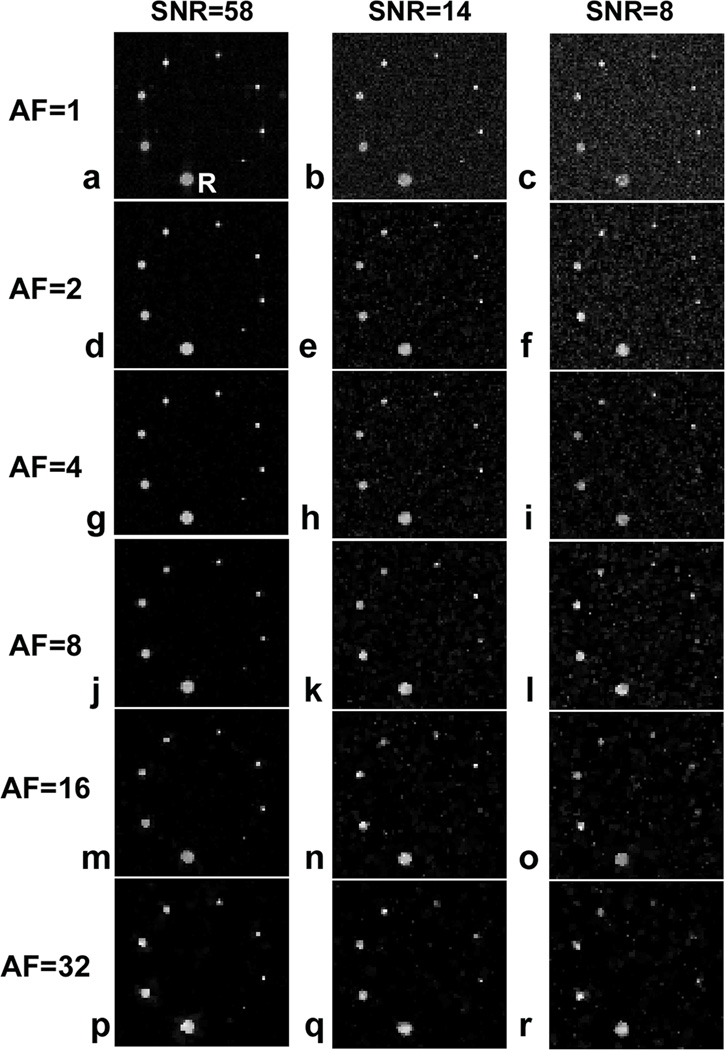
The 19F phantom data acquired with 3D CS RARE are shown in Fig. 4. At all SNR levels examined, undersampling k-space up to 32 times appeared to readily resolve the five largest capillaries comprising >5 voxels. The image quality of the three smallest capillaries with cross-section less than five voxels was only preserved at the highest SNR (=58) (Figs. 4a,d,g,j,m,p) but not at the two lower SNR levels. For all capillaries, no significant blurring was detected at the capillary boundaries with AF<4 (Figs. 4a–i), however, a slight blurring onset was visible at AF=8 (Figs. 4j–l). With AF=16 or 32, noticeable artifacts and shape changes were detectable at the capillary edges (Figs. 4m–o, p–r). Interestingly, the CS de-noising attribute (22) associated with the CS reconstruction was significant, as evident, for example, by comparing the noisy conventional image Fig. 4c with Figs. 4f,i,l,o,r. Such noise elimination is due to the non-linear nature of CS image reconstruction that enforces a constraint on total variation (22).
Fig. 4.
3D CS acquisition and reconstruction of 19F phantom with different AF-values and SNR. Here R=reference capillary. The other capillaries have the cross sectional areas of 0.563R, 0.380R, 0.250R, 0.145R, 0.100R, 0.056R, and 0.025R. Images are displayed on the same intensity scale.
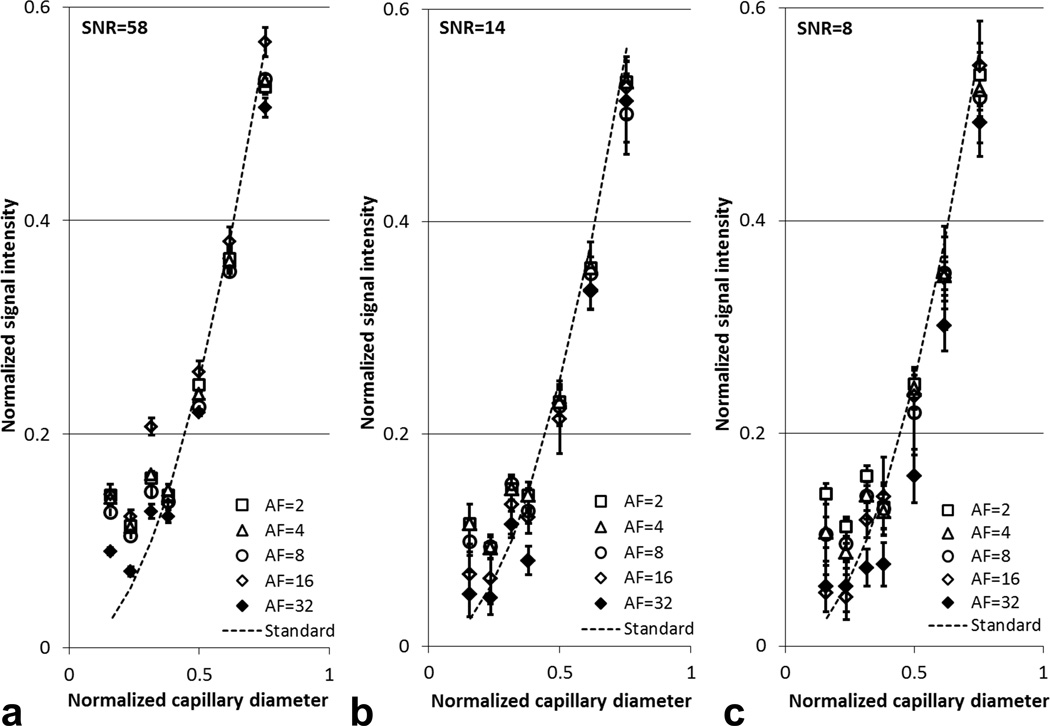
Consistent with the simulated reconstruction, 19F signal quantification obtained from CS RARE showed good agreement to the theoretical standard (Fig. 5). When AF ranged from 2 to 8, less than ±10% signal difference was observed in the four largest capillaries when compared to the standard signal. These signal differences increase with AF, high noise content (Fig. 5c), and decreasing capillary size (Figs. 5a–c).
Fig. 5.
Quantification results from 3D CS acquisition and reconstruction of 19F phantom at different AF-values and SNR. The abscissae are the phantom capillary diameters normalized to the largest capillary. The ‘Standard’ is the theoretical 19F signal values calculated using the cross sectional area of different capillaries normalized to that of the largest capillary. The experimental results agree with the theoretical signal values for capillaries with diameter greater than 0.38 (~6 voxels). The error bars are the standard deviation among six contiguous slices.
Importantly, in the above phantom studies the image SNR/t significantly improved using CS, provided the images have a relatively high SNR. For example, for AF=1 we obtained SNR=58.6 with t~54 min, and for AF=8, a SNR=65.1 was measured with t~7 min. Thus, the SNR/t was 1.1 versus 9.3 for AF=1 and 8, respectively, and overall, CS yielded a ~8.5-fold improvement in SNR/t for AF=8.
3D CS RARE in vivo
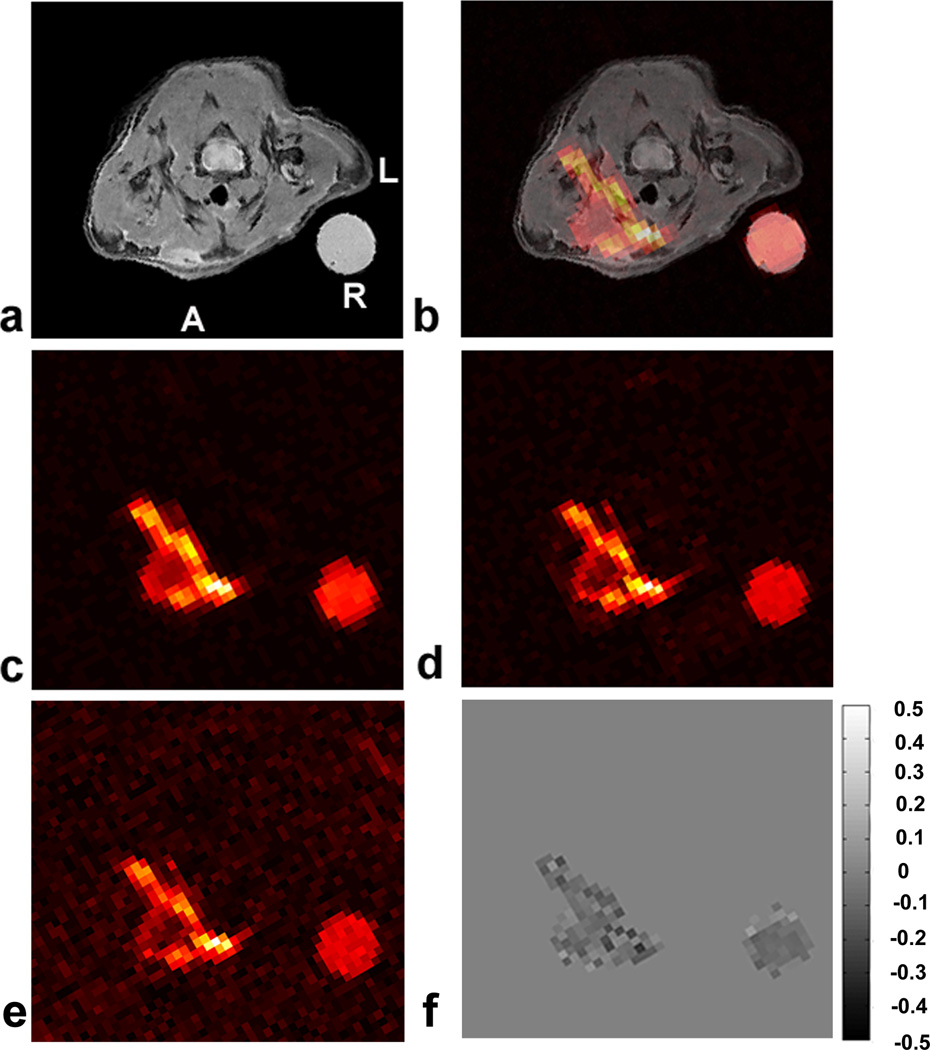
Figure 6 shows representative 1H/19F images in a mouse model of localized inflammation induced by wounding. Inflammation is observed at the right anterior side of the animal, proximal to the jugular vein (Figs. 6a–b). The 19F signal indicates the presence of phagocytic macrophages at the surgical site that have taken up the PFC emulsion droplets. With AF=8 (Fig, 6c), the 19F imaging time was <9 minutes with NA=8 yielding a high SNR image (SNR~44.7, averaged over an ROI). The 19F signal was present in a volume that included 14 contiguous axial slices. No significant blurring in the AF=8 image (Fig. 6b) was apparent at the edge of the lesion or external reference capillary when compared to the AF=1 and NA=8 CS-RARE image (SNR~34.7, averaged over an ROI), as shown in Fig. 6d. The fully sampled images (AF=1) were reconstructed using the same CS reconstruction procedure, thus they are denoised versions of the conventional RARE images. CS acceleration (Fig. 6c) preserved the spatial variation of fluorine intensity compared to the full k-space sampling (Fig. 6d). The de-noising effect by undersampled CS reconstruction was also observed in vivo (Fig 6d), where the SNR was observed to be improved by ~13% in the AF=8 image. For comparison, Fig. 6e shows a fully-sampled imaged with NA=1, having the same imaging time as Fig. 6c with CS acceleration; this image shows degraded image quality.
Fig. 6.
In vivo 19F 3D CS RARE images in a localized inflammation mouse model. The pseudo-colored images show macrophage accumulation in the region of wounding-induced inflammation. Panel (a) shows a T2-weighted anatomical 1H image. Panel (b) is a 1H/19F fused image of (a+c). Panel (c) is a single slice from a 3D 19F CS RARE image with AF=8 and NA=8. Panel (d) is an AF=1, NA=8 (fully-sampled k-space) RARE image. Panel (e) is a single average image of panel (c), i.e., AF=1 and NA=1. Panel (f) is the difference image of AF=8 and AF=1(c–d) for NA=8. The PFC emulsion was injected 24 hours after injury and imaged at 72 hours. Here, A=anterior wall, L=left, and R= reference.
With aid of the external PFC capillary in the image FOV, we analyzed the total number of 19F spins observed in the lesion in vivo, which is proportional to the macrophage burden (16). The results were 6.63×10¹⁹ and 6.22×10¹⁹ fluorine-19 spins for AF=1 (Fig. 6d) and AF=8 (Fig. 6c), respectively. Thus, the spin quantification was in close agreement in this single animal (N=1), differing by only ~6% between the two k-space sampling patterns. Additionally, the number of 19F spins was quantified in the relatively low SNR, fully-sampled, single average image (AF=1, NA=1, Fig. 6e). The spin quantification was ~9% lower than that of the fully-sampled NA=8 image (Fig. 6d).
Consistent with the phantom studies, CS significantly improves the image SNR/t in vivo, provided that the images have relatively high SNR. For the 19F inflammation data with NA=8, the measured SNR/t was 4.5 and 44.7 for AF=1 and 8, respectively, and this represents approximately a 10-fold improvement.
Discussion
CS is emerging as a useful method to significantly reduce MRI acquisition time by exploiting data sparsity and undersampling k-space beyond the Nyquist criteria. MRI applications of CS methods exploit data sparsity either in the image domain, time domain (25), or transformed domains (22,31). In this study, we applied 3D CS acquisition and reconstruction methods in the context of 19F cell tracking. Generally, the 19F signal of labeled cells appears as ‘hot-spots’ in MRI images, that generally occupy of order 0.5–5% of the total image voxels, and thus CS is potentially well suited for 19F cell tracking. In phantom studies and in an in vivo model, we found that CS is effective in reducing the image acquisition time by at least 8-fold without seriously affecting SNR, image features, and 19F spin quantification. Overall, the image SNR/t, can be dramatically enhanced using CS, thus lowering barriers towards the clinical adoption of 19F cell tracking. In addition to its denosing effect, CS reconstruction may potentially cause image distortions and systematic intensity differences in the objects, especially with high AF values (e.g., Figs. 4a versus 4p).
Several factors influence the quality of the CS reconstructed 19F image. The AF value is the most important factor. With an AF up to 8-fold, we found that both simulated and real CS reconstructed images showed excellent quality (Fig. 4a–l). When AF was increased to 16 or 32, some signal degradation occurred, with noticeable edge blurring (Figs. 4m–r). In addition, the quantitative results with high AF were less accurate in both the simulated and real CS reconstructions (Figs. 2&5). Signal degradation by high AF seemed to be most significant at low SNR (Fig. 5c). The accuracy of CS reconstruction also depends on the image feature size. Large capillaries (>5 voxels) were well represented in both simulated and real CS reconstruction, but feature sizes of less than five voxels, were subjected to detectable quantification errors (Figs. 2 & 5). De-noising attributes of CS attenuate very low SNR voxels, and the signal magnitude shrinking effect of L1-norm may contribute to the quantification error of the smaller capillaries that contain fractionally higher numbers of partial volume voxels. With CS reconstruction, signal from the three smallest capillaries visually resembles that in conventional image (Fig. 4), but quantitative differences were detected in signal intensities (Fig. 5). Further refinements in the CS algorithms may be needed to improve the reconstruction accuracy of features comprising very small numbers of voxels. Based on the findings in our phantom studies, an acceleration factor of 8-fold was selected for our preliminary, proof-of-principle in vivo inflammation study. Even with the presence of residual respiratory and other physiological motion, image features and 19F signal quantification using CS showed excellent similarity compared to conventional imaging.
In this study, CS reconstruction was performed using two regularization terms, i.e., the L1- and TV-norm constraints. Weighting of the two regularization terms was customized to achieve reconstruction quality. The L1-norm constraint enforces minimization so that a 19F image can be represented by a small number of numerical values, thereby enforcing signal sparsity. Thus, L1-norm has been reported to have a shrinking effect on image features, which can be modulated by its weighting (22). The TV minimization constrains reconstruction under the assumption that a 19F image has limited intensity variation between neighboring pixels. TV-norm intrinsically suppresses image noise since the same volume of noise generally presents a larger total variation than the 19F intensity. An effective SNR improvement in CS image was observed compared to the AF=1 image due to the constraint of TV-norm (Figs. 4,6), which is consistent with previous reports (22,32,33).
To further improve CS reconstruction quality, additional regularization terms can be used based on a priori knowledge of image features, at the cost of increased computational complexity. Phase constraints (32), geometry constraints (34), and motion constraints (34) have been proposed to improve CS reconstruction. L0-norm (35,36) and derivatives of TV-norm (37) have also been proposed to improve feature representation and suppress noise and artifacts.
The imaging method methods employed in our study used Cartesian k-space sampling with a predetermined 3D randomized sampling scheme that undersampled k-space in two phase encoding directions. Optimization of random k-space trajectories can be made for different applications by Bayesian selection (38). Non-Cartesian k-space sampling patterns, including radial (37,39) and spiral sampling (40), which intrinsically sample densely near the k-space center, may be used to further improve the SNR/time of CS images compared to Cartesian sampling.
CS can improve the image SNR/time and therefore enhance the utility of 19F cell tracking to detect sparse cell numbers by enabling increased signal averaging within the temporal confines of an imaging session. Previous studies have shown that the minimum cell detection sensitivity for 19F cell tracking is of order 103-104 cells per voxel for high-field animal scanners (16) and 104 to 105 cells per voxel for clinical MRI systems (20). The voxel size for a study can be set by the MRI-practitioner depending on cell sparsity in tissue. Experimental details, such as magnitude of PFC cell uptake, the image acquisition methods, magnetic field strength, and detector coil configuration, determine the actual sensitivity for a particular study. Importantly, 19F cell tracking does not demand a high 19F SNR. Because there is negligible 19F background, any 19F signal detected is from labeled cells. Unlike 1H anatomical imaging, where one relies on its high SNR to resolve detailed anatomy and organ definition, the 19F image only needs to display localized ‘pools’ of cells at arbitrarily low SNR, and the 1H overlay provides the detailed anatomical context.
We note that previous studies that quantitatively analyzed low SNR (SNR<6) 19F magnitude images for in vivo cytometry applications (12) corrected for the bias created by the Rician distributed noise (41) to improve spin-counting accuracy. Unlike the Rician noise distribution of the conventional magnitude images, the noise distribution of the undersampled CS images remains undefined, and future work will be required to model incoherent noise in CS images. The method for SNR estimation used herein assumes spatially homogeneous Gaussian noise, however, the noise in the CS reconstructed images does not satisfy this condition. Thus, there is a loss of accuracy in quantitative SNR measurements, and these may not give reliable information on image quality. Additionally, the conclusion that SNR/t is improved with CS is relevant only for the high SNR measurements, where all features are well preserved by the reconstruction. At low SNR, features details may be lost in the CS reconstruction, causing artifacts, as observed in the phantom experiments.
Overall, we have shown that CS can increase the utility of 19F cell tracking. It delivers accurate feature representation and quantification of 19F signal with a significant reduction of imaging time over conventional imaging. The reduction of imaging time afforded by CS will likely have the greatest impact in the clinical use of 19F-based cell tracking, where imaging times would otherwise be prohibitively long in certain applications.
Acknowledgements
We thank Dr. Zhi-Pei Liang and Hien Nguyen for helpful suggestions. We acknowledge support from the National Institutes of Health grant R01-CA134633, the Pittsburgh NMR Center for Biomedical Research, supported by P41-EB001977, and the Dana Foundation.
References
- 1.Arbab AS, Liu W, Frank JA. Cellular magnetic resonance imaging: current status and future prospects. Expert Rev Med Devic. 2006;3(4):427–439. doi: 10.1586/17434440.3.4.427. [DOI] [PubMed] [Google Scholar]
- 2.Himmelreich U, Dresselaers T. Cell labeling and tracking for experimental models using magnetic resonance imaging. Methods. 2009;48(2):112–124. doi: 10.1016/j.ymeth.2009.03.020. [DOI] [PubMed] [Google Scholar]
- 3.Bulte JW. In vivo MRI cell tracking: clinical studies. AJR Am J Roentgenol. 2009;193(2):314–325. doi: 10.2214/AJR.09.3107. [DOI] [PMC free article] [PubMed] [Google Scholar]
- 4.Tran TD, Caruthers SD, Hughes M, Marsh JN, Cyrus T, Winter PM, Neubauer AM, Wickline SA, Lanza GM. Clinical applications of perfluorocarbon nanoparticles for molecular imaging and targeted therapeutics. Int J Nanomed. 2007;2(4):515–526. [PMC free article] [PubMed] [Google Scholar]
- 5.Bulte JW, Arbab AS, Douglas T, Frank JA. Preparation of magnetically labeled cells for cell tracking by magnetic resonance imaging. Methods Enzymol. 2004;386:275–299. doi: 10.1016/S0076-6879(04)86013-0. [DOI] [PubMed] [Google Scholar]
- 6.Janjic JM, Ahrens ET. Fluorine-containing nanoemulsions for MRI cell tracking. Wiley Interdiscip Rev Nanomed Nanobiotechnol. 2009;1(5):492–501. doi: 10.1002/wnan.35. [DOI] [PMC free article] [PubMed] [Google Scholar]
- 7.Noth U, Morrissey SP, Deichmann R, Jung S, Adolf H, Haase A, Lutz J. Perfluoro-15-crown-5-ether labelled macrophages in adoptive transfer experimental allergic encephalomyelitis. Artif Cell Blood Sub. 1997;25(3):243–254. doi: 10.3109/10731199709118914. [DOI] [PubMed] [Google Scholar]
- 8.Flogel U, Ding Z, Hardung H, Jander S, Reichmann G, Jacoby C, Schubert R, Schrader J. In vivo monitoring of inflammation after cardiac and cerebral ischemia by fluorine magnetic resonance imaging. Circulation. 2008;118(2):140–148. doi: 10.1161/CIRCULATIONAHA.107.737890. [DOI] [PMC free article] [PubMed] [Google Scholar]
- 9.Weise G, Basse-Luesebrink TC, Wessig C, Jakob PM, Stoll G. In vivo imaging of inflammation in the peripheral nervous system by (19)F MRI. Exp Neurol. 2011;229(2):494–501. doi: 10.1016/j.expneurol.2011.03.020. [DOI] [PubMed] [Google Scholar]
- 10.Hitchens TK, Ye Q, Eytan DF, Janjic JM, Ahrens ET, Ho C. 19F MRI detection of acute allograft rejection with in vivo perfluorocarbon labeling of immune cells. Magn Reson Med. 2011;65(4):1144–1153. doi: 10.1002/mrm.22702. [DOI] [PMC free article] [PubMed] [Google Scholar]
- 11.Smirnov P, Lavergne E, Gazeau F, Lewin M, Boissonnas A, Doan BT, Gillet B, Combadiere C, Combadiere B, Clement O. In vivo cellular imaging of lymphocyte trafficking by MRI: a tumor model approach to cell-based anticancer therapy. Magn Reson Med. 2006;56(3):498–508. doi: 10.1002/mrm.20996. [DOI] [PubMed] [Google Scholar]
- 12.Srinivas M, Morel PA, Ernst LA, Laidlaw DH, Ahrens ET. Fluorine-19 MRI for visualization and quantification of cell migration in a diabetes model. Magn Reson Med. 2007;58(4):725–734. doi: 10.1002/mrm.21352. [DOI] [PubMed] [Google Scholar]
- 13.Shapiro EM, Medford-Davis LN, Fahmy TM, Dunbar CE, Koretsky AP. Antibody-mediated cell labeling of peripheral T cells with micron-sized iron oxide particles (MPIOs) allows single cell detection by MRI. Contrast Media Mol Imaging. 2007;2(3):147–153. doi: 10.1002/cmmi.134. [DOI] [PMC free article] [PubMed] [Google Scholar]
- 14.Liu W, Frank JA. Detection and quantification of magnetically labeled cells by cellular MRI. Eur J Radiol. 2009;70(2):258–264. doi: 10.1016/j.ejrad.2008.09.021. [DOI] [PMC free article] [PubMed] [Google Scholar]
- 15.Ruiz-Cabello J, Barnett BP, Bottomley PA, Bulte JW. Fluorine (19F) MRS and MRI in biomedicine. NMR Biomed. 2011;24(2):114–129. doi: 10.1002/nbm.1570. [DOI] [PMC free article] [PubMed] [Google Scholar]
- 16.Ahrens ET, Flores R, Xu H, Morel PA. In vivo imaging platform for tracking immunotherapeutic cells. Nat Biotechnol. 2005;23(8):983–987. doi: 10.1038/nbt1121. [DOI] [PubMed] [Google Scholar]
- 17.Helfer BM, Balducci A, Nelson AD, Janjic JM, Gil RR, Kalinski P, de Vries IJ, Ahrens ET, Mailliard RB. Functional assessment of human dendritic cells labeled for in vivo (19)F magnetic resonance imaging cell tracking. Cytotherapy. 2010;12(2):238–250. doi: 10.3109/14653240903446902. [DOI] [PMC free article] [PubMed] [Google Scholar]
- 18.Kadayakkara DK, Beatty PL, Turner MS, Janjic JM, Ahrens ET, Finn OJ. Inflammation driven by overexpression of the hypoglycosylated abnormal mucin 1 (MUC1) links inflammatory bowel disease and pancreatitis. Pancreas. 2010;39(4):510–515. doi: 10.1097/MPA.0b013e3181bd6501. [DOI] [PMC free article] [PubMed] [Google Scholar]
- 19.Kraitchman DL, Heldman AW, Atalar E, Amado LC, Martin BJ, Pittenger MF, Hare JM, Bulte JWM. In vivo magnetic resonance imaging of mesenchymal stem cells in myocardial infarction. Circulation. 2003;107(18):2290–2293. doi: 10.1161/01.CIR.0000070931.62772.4E. [DOI] [PubMed] [Google Scholar]
- 20.Partlow KC, Chen J, Brant JA, Neubauer AM, Meyerrose TE, Creer MH, Nolta JA, Caruthers SD, Lanza GM, Wickline SA. 19F magnetic resonance imaging for stem/progenitor cell tracking with multiple unique perfluorocarbon nanobeacons. Faseb J. 2007;21(8):1647–1654. doi: 10.1096/fj.06-6505com. [DOI] [PubMed] [Google Scholar]
- 21.Kaneda MM, Caruthers S, Lanza GM, Wickline SA. Perfluorocarbon Nanoemulsions for Quantitative Molecular Imaging and Targeted Therapeutics. Ann Biomed Eng. 2009;37(10):1922–1933. doi: 10.1007/s10439-009-9643-z. [DOI] [PMC free article] [PubMed] [Google Scholar]
- 22.Lustig M, Donoho D, Pauly JM. Sparse MRI: The application of compressed sensing for rapid MR imaging. Magn Reson Med. 2007;58(6):1182–1195. doi: 10.1002/mrm.21391. [DOI] [PubMed] [Google Scholar]
- 23.Candes E, Romberg J. Sparsity and incoherence in compressive sampling. Inverse Problems. 2006;23(3):969–985. [Google Scholar]
- 24.Romberg J. Imaging via compressive sampling. Ieee Signal Proc Mag. 2008;25(2):14–20. [Google Scholar]
- 25.Gamper U, Boesiger P, Kozerke S. Compressed sensing in dynamic MRI. Magn Reson Med. 2008;59(2):365–373. doi: 10.1002/mrm.21477. [DOI] [PubMed] [Google Scholar]
- 26.Doneva M, Bornert P, Eggers H, Stehning C, Senegas J, Mertins A. Compressed sensing reconstruction for magnetic resonance parameter mapping. Magn Reson Med. 2010;64(4):1114–1120. doi: 10.1002/mrm.22483. [DOI] [PubMed] [Google Scholar]
- 27.Cukur T, Lustig M, Nishimura DG. Improving non-contrast-enhanced steady-state free precession angiography with compressed sensing. Magn Reson Med. 2009;61(5):1122–1131. doi: 10.1002/mrm.21907. [DOI] [PMC free article] [PubMed] [Google Scholar]
- 28.Larson PE, Hu S, Lustig M, Kerr AB, Nelson SJ, Kurhanewicz J, Pauly JM, Vigneron DB. Fast dynamic 3D MR spectroscopic imaging with compressed sensing and multiband excitation pulses for hyperpolarized 13C studies. Magn Reson Med. 2011;65(3):610–619. doi: 10.1002/mrm.22650. [DOI] [PMC free article] [PubMed] [Google Scholar]
- 29.Kampf T, Fischer A, Basse-Lusebrink TC, Ladewig G, Breuer F, Stoll G, Jakob PM, Bauer WR. Application of compressed sensing to in vivo 3D (1)F CSI. J Magn Reson. 2010;207(2):262–273. doi: 10.1016/j.jmr.2010.09.006. [DOI] [PubMed] [Google Scholar]
- 30.Schirra C, Brunner D, Keupp J, Razavi R, Schaeffter T, Kozerke S. Compressed Sensing for Highly Accelerated 3D Visualization of 19F-Catheters. Proc ISMRM. 2009 [Google Scholar]
- 31.Ajraoui S, Lee KJ, Deppe MH, Parnell SR, Parra-Robles J, Wild JM. Compressed sensing in hyperpolarized 3He lung MRI. Magn Reson Med. 2010;63(4):1059–1069. doi: 10.1002/mrm.22302. [DOI] [PubMed] [Google Scholar]
- 32.Kim YC, Narayanan SS, Nayak KS. Accelerated three-dimensional upper airway MRI using compressed sensing. Magn Reson Med. 2009;61(6):1434–1440. doi: 10.1002/mrm.21953. [DOI] [PMC free article] [PubMed] [Google Scholar]
- 33.Hu S, Lustig M, Chen AP, Crane J, Kerr A, Kelley DA, Hurd R, Kurhanewicz J, Nelson SJ, Pauly JM, Vigneron DB. Compressed sensing for resolution enhancement of hyperpolarized 13C flyback 3D-MRSI. J Magn Reson. 2008;192(2):258–264. doi: 10.1016/j.jmr.2008.03.003. [DOI] [PMC free article] [PubMed] [Google Scholar]
- 34.Schirra CO, Weiss S, Krueger S, Pedersen SF, Razavi R, Schaeffter T, Kozerke S. Toward true 3D visualization of active catheters using compressed sensing. Magn Reson Med. 2009;62(2):341–347. doi: 10.1002/mrm.22001. [DOI] [PubMed] [Google Scholar]
- 35.Chartrand R. Exact reconstruction of sparse signals via nonconvex minimization. Ieee Signal Proc Let. 2007;14(10):707–710. [Google Scholar]
- 36.Trzasko J, Manduca A. Highly Undersampled Magnetic Resonance Image Reconstruction via Homotopic l(0)-Minimization. IEEE Trans Med Imaging. 2009;28(1):106–121. doi: 10.1109/TMI.2008.927346. [DOI] [PubMed] [Google Scholar]
- 37.Knoll F, Bredies K, Pock T, Stollberger R. Second Order Total Generalized Variation (TGV) for MRI. Magnet Reson Med. 2011;65:480–491. doi: 10.1002/mrm.22595. [DOI] [PMC free article] [PubMed] [Google Scholar]
- 38.Seeger M, Nickisch H, Pohmann R, Scholkopf B. Optimization of k-space trajectories for compressed sensing by Bayesian experimental design. Magn Reson Med. 2010;63(1):116–126. doi: 10.1002/mrm.22180. [DOI] [PubMed] [Google Scholar]
- 39.Chan RW, Ramsay EA, Cheung EY, Plewes DB. The influence of radial undersampling schemes on compressed sensing reconstruction in breast MRI. Magn Reson Med. 2012;67:363–377. doi: 10.1002/mrm.23008. [DOI] [PubMed] [Google Scholar]
- 40.Santos JM, Cunningham CH, Lustig M, Hargreaves BA, Hu BS, Nishimura DG, Pauly JM. Single breath-hold whole-heart MRA using variable-density spirals at 3T. Magn Reson Med. 2006;55(2):371–379. doi: 10.1002/mrm.20765. [DOI] [PubMed] [Google Scholar]
- 41.Gudbjartsson H, Patz S. The Rician distribution of noisy MRI data. Magn Reson Med. 1995;34(6):910–914. doi: 10.1002/mrm.1910340618. [DOI] [PMC free article] [PubMed] [Google Scholar]


