
Figure 1.
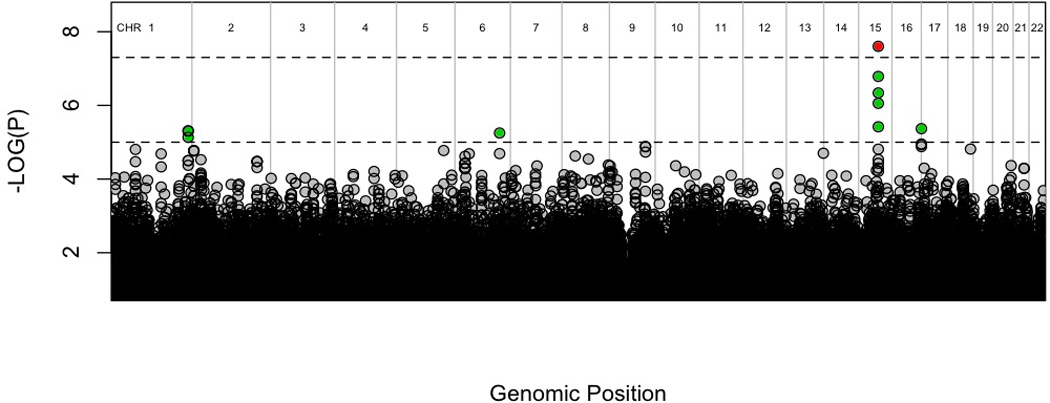
Manhattan plot of genome-wide association results in discovery group.
Dashed lines and colors represent suggestive and genome-wide significance respectively, with green=p<10−5 and red=p<5×10⁻⁸.
Official websites use .gov
A
.gov website belongs to an official
government organization in the United States.
Secure .gov websites use HTTPS
A lock (
) or https:// means you've safely
connected to the .gov website. Share sensitive
information only on official, secure websites.
Manhattan plot of genome-wide association results in discovery group.
Dashed lines and colors represent suggestive and genome-wide significance respectively, with green=p<10−5 and red=p<5×10⁻⁸.