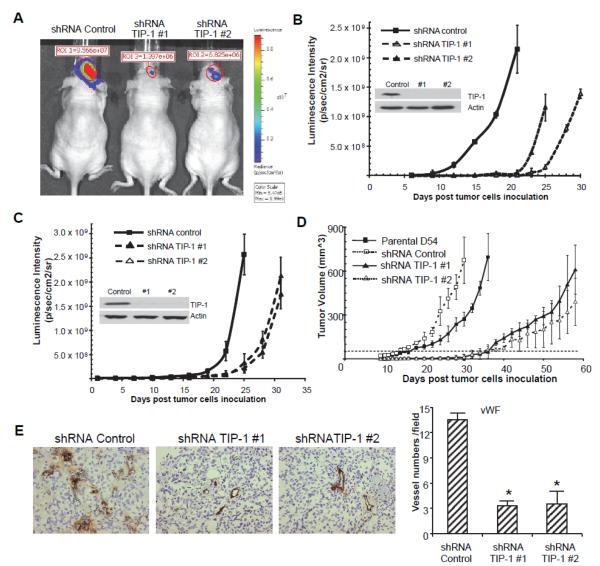
Fig. 2.
TIP-1 knockdown within human glioblastoma cell lines delays tumor formation and impairs angiogenesis in nude mice. D54 or U87 cells were genetically modified with recombinant lentiviruses expressing luciferase and TIP-1-targeted or a control shRNA before the intracranial inoculation. TIP-1 expression in the transfected cells was verified by western blot analyses with a specific antibody (inserts in B & C). Tumor formation and growth were monitored with bioluminescence imaging (BLI) upon luciferase expression. (A) Representative BLI data collected at day 21 post D54 cell inoculation, quantitative measurements of tumor growth were shown upon BLI signal intensity. (B) D54 and (C) The graphs show the time course of tumor formation and growth of D54 (B) and U87 (C) cells in nude mice (n = 5 for each group). (D) Growth curves of D54 tumors in a subcutaneously implanted xenograft model (n=5 for each group). A dashed line indicates tumor size as of 50 mm3. (E) Tumor-associated blood vessels were visualized with vWF staning (brown) and quantified upon images. Tumors were resected at day 12 post inoculation in a subcutaneously implanted xenograft model. Hematoxylin (blue) was used for counterstaining. Quantification was based upon more than 12 independent microscopic fields for each group. Shown are mean +/− SD. * p<0.05 compared to the shRNA control by the Student’s t-test.

