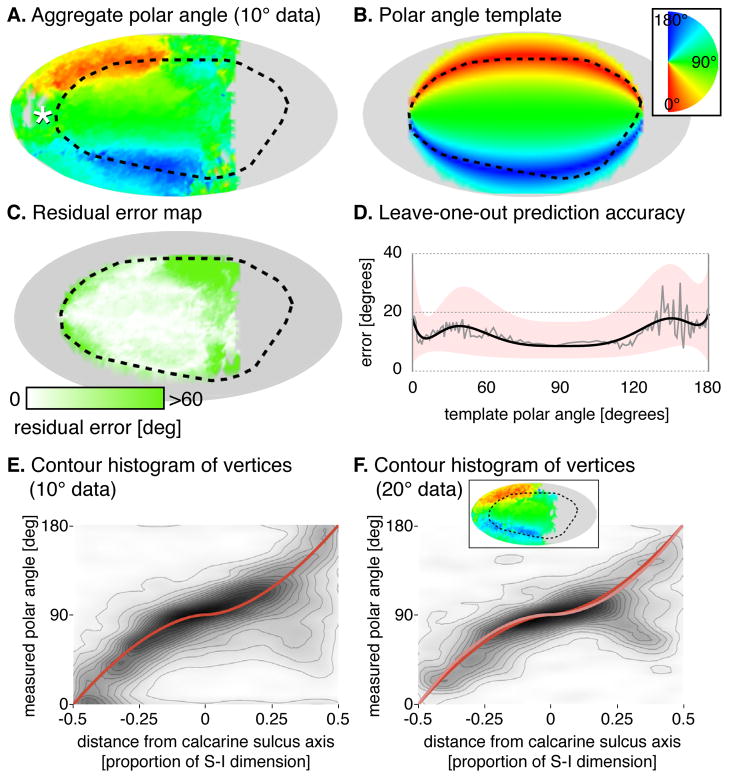
Fig. 2. Polar angle prediction.
(A) Aggregate polar angle data of 18 of the 19 subjects shown visual stimuli within 10° of fixation (one significant outlier excluded). White asterisk is the foveal confluence; black dotted line is the Hinds et al. V1 border [6]. (B) Algebraic template, fit to the aggregate polar angle map. (C) Absolute residual error between the template fit and aggregate data. (D) Median absolute prediction error across vertices and subjects by template polar angle. The median error (grey), is fit by a fifth-order polynomial (black) with the similarly fit upper and lower quartiles defining the border of the pink region. (E) Contour histogram of all vertices from 10° dataset subjects, binned by measured polar angle and superior-inferior position in the template space. The template fit is shown in red. Each contour line corresponds to ~2,000 vertices. (F) Corresponding contour histogram from 20° dataset subjects. The template fit to the 20° dataset is in pink, and the fit to the 10° dataset is reproduced from Fig 2E in red. Each contour line corresponds to ~700 vertices. Inset is the aggregate map for the 20° dataset. Fig. S2A presents the polar angle aggregates and fits by hemisphere, and Table S1 provides the exact formulae measurements.

