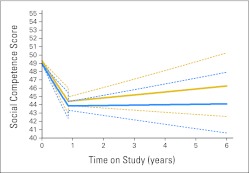
Fig 3.
Patient risk status and parent-reported social competence before and after mean time until first follow-up (0.86 years) using a discontinuous-slope generalized linear mixed effects model (T scores: mean, 50; standard deviation, 10). Higher social competence scores reflect better functioning. Solid blue line indicates high risk; dashed blue lines indicate 95% CI. Solid gold line indicates average risk; dashed gold lines indicate 95% CI.

