Figure 2.
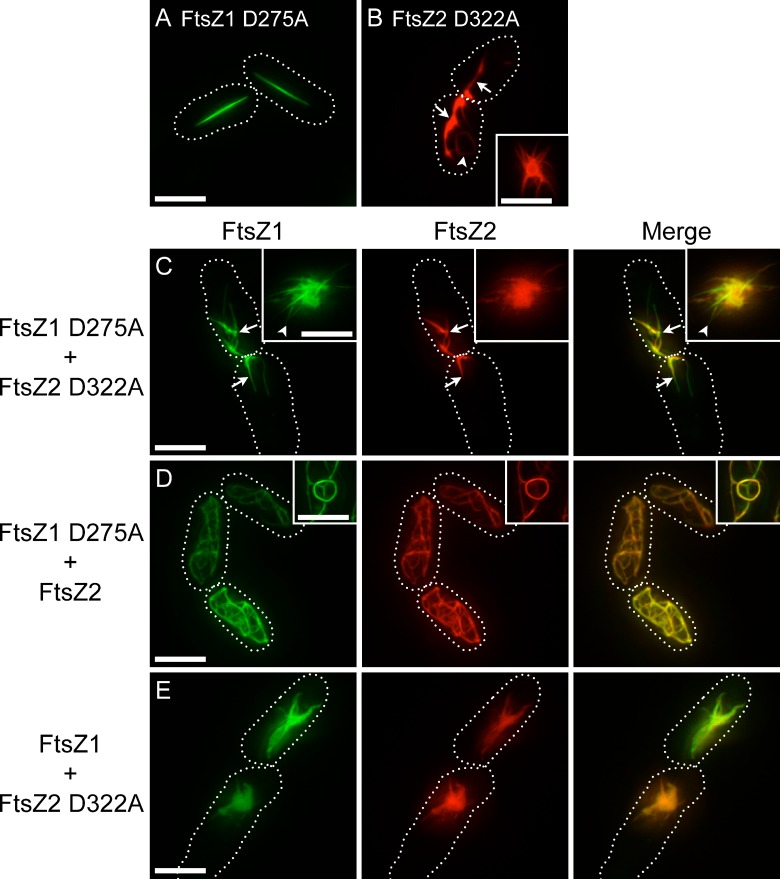
Filament morphologies in strains expressing GTPase-deficient FtsZ1 and FtsZ2. Epifluorescence micrographs of cells expressing FtsZ1 D275A (A), FtsZ2 D322A (B), FtsZ1 D275A and FtsZ2 D322A (C), FtsZ1 D275A and FtsZ2 (D), or FtsZ1 and FtsZ2 D322A (E). WT and mutant FtsZ1 and FtsZ2 proteins were fused to eYFP (green) and eCFP (red), respectively. Insets show regions in different cells from the same cultures as in larger panels. Dotted lines show cell outlines. Bars, 5 µm.

