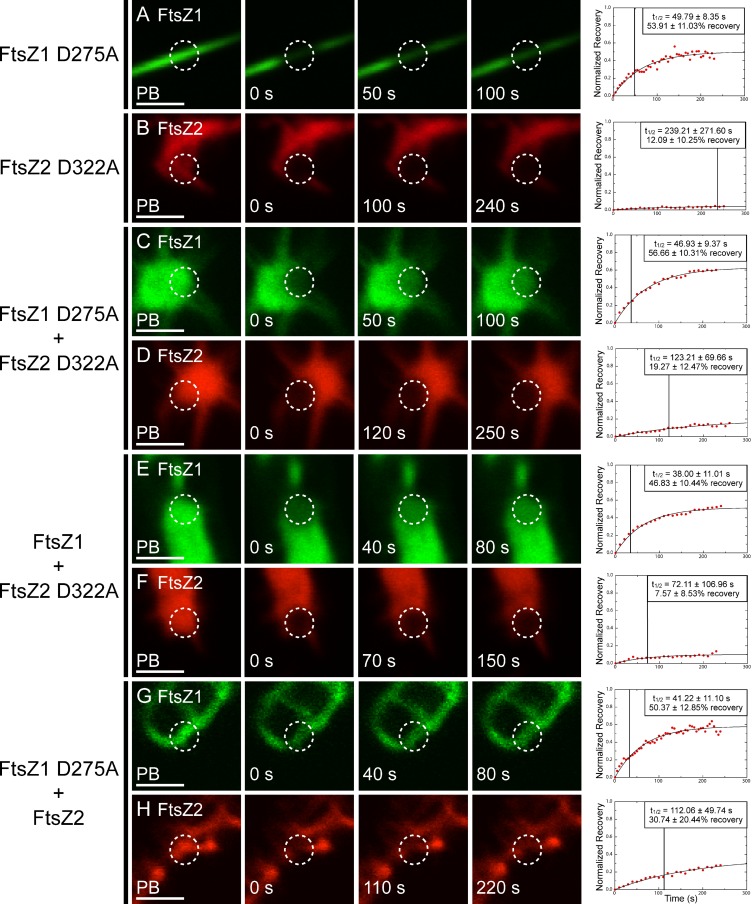
Figure 4.
Dynamics of GTPase-deficient FtsZ1 and FtsZ2 expressed in various combinations. S. pombe cells expressing FtsZ1 D275A (A; see also Video 3), FtsZ2 D322A (B, panel 3 is 100 s recovery, panel 4 is the image acquired closest to t1/2; see also Video 4), FtsZ1 D275A and FtsZ2 D322A (C and D), FtsZ1 and FtsZ2 D322A (E and F), and FtsZ1 D275A and FtsZ2 (G and H). WT and mutant FtsZ1 and FtsZ2 proteins were fused to eYFP (green) and eCFP (red), respectively. Images from left to right (except in B) represent fluorescence signals in photobleached regions (circled) just before bleaching (PB), at the time of bleaching (0 s), at the time closest to t1/2, and at twice t1/2. Representative plots of fluorescence recovery vs. time are shown at right. Data in each plot were normalized to the PB fluorescence signal (1 on the y-axis) and the signal intensity at the time of bleaching (0 on the y-axis). Boxes in the plots show the average t1/2 (also indicated by the vertical lines) and average percent recovery ± SD for 10 independent FRAP datasets obtained for each strain. Bars, 2 µm.

