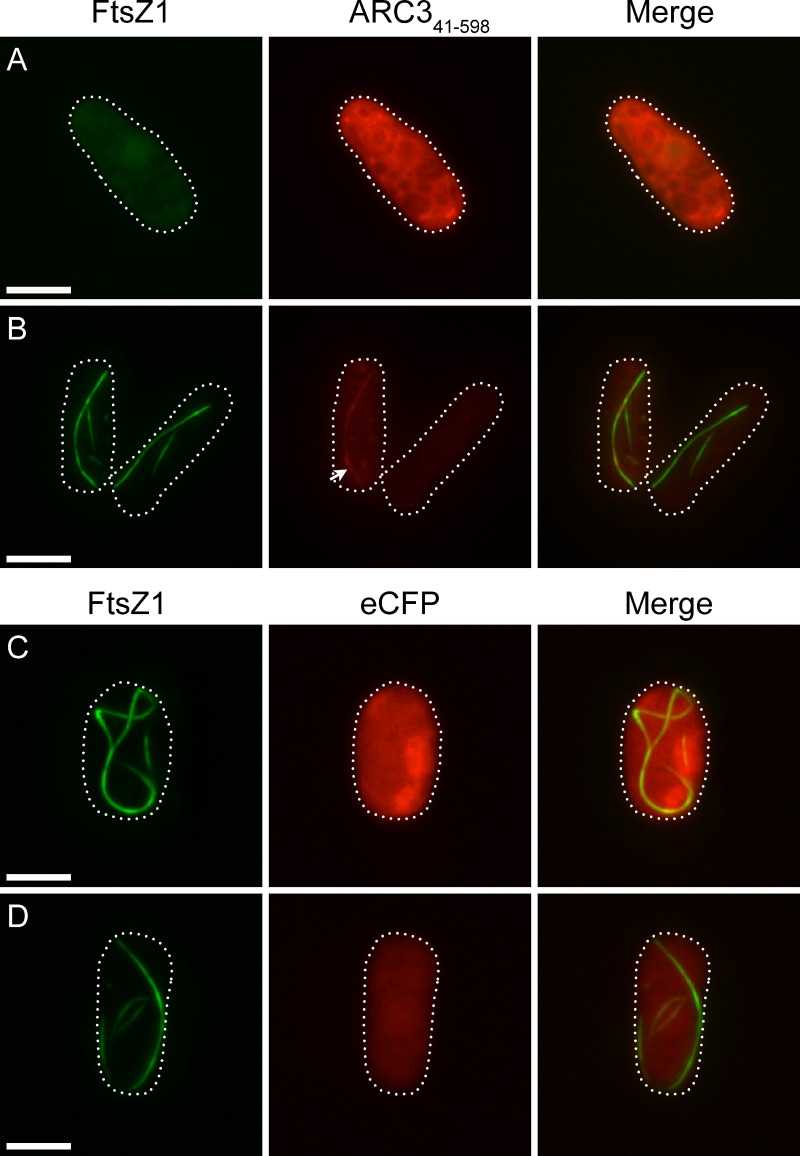
Figure 5.
Effect of ARC341–598 on FtsZ1 assembly. Epifluorescence micrographs of S. pombe cells expressing FtsZ1-eYFP (green) and higher levels of ARC341–598–eCFP (A, red), lower levels of ARC341–598–eCFP (B), higher levels of eCFP (C), or lower levels of eCFP (D). Exposure times and image processing for cells in A and B were identical. Cells in C and D were taken from the same identically processed image; hence, differences in fluorescence intensity reflect differences in protein level. Dotted lines show cell outlines. Bars, 5 µm.

