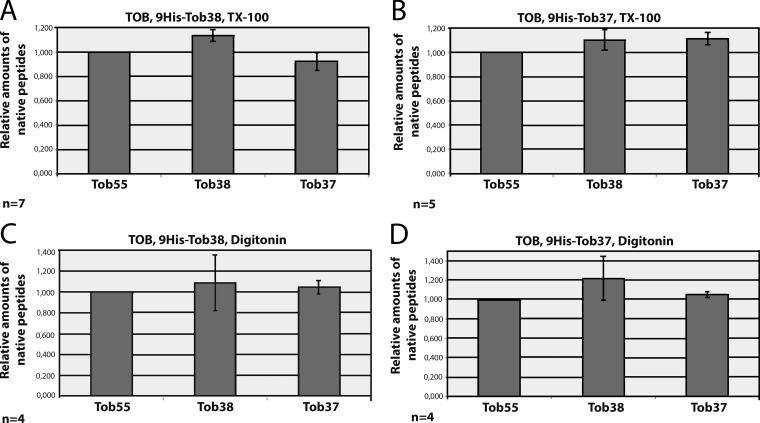
Figure 3.
Tob55, Tob38, and Tob37 assemble in a 1:1:1 stoichiometry. (A–F) The TOB complex was isolated from cells expressing His9-Tob38 (A and C) or His9-Tob37 (B and D) using either TX-100 (A and B) or digitonin (C and D). The samples were subjected to BNGE, stained with Coomassie blue, and the bands were cut out from the gel and analyzed by IDMS. The amount of each subunit was determined by comparing the areas under the peaks for the labeled and native peptides. The relative amounts of the native peptides and thereby the native proteins were normalized relative to Tob55, which was set to 1. The error bars depict the standard deviation of the measurements from several (n) samples.

