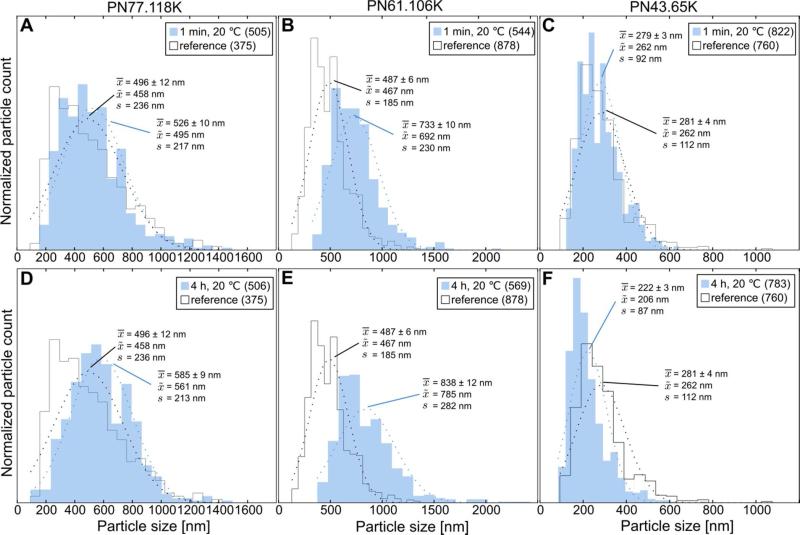
Figure 5.
Particle diameter size distributions acquired from SEM micrographs for as-prepared particles (black line) and for freeze-dried particles after being one minute or four hours in water at 20 °C (blue area). Sample mean (x-bar), median (x-tilde) and standard deviation s, were calculated from the statistics. The amount of particles used for the statistics is written inside the parentheses in the label box. Normal distributions fitted to the data have been plotted with dashed lines.

