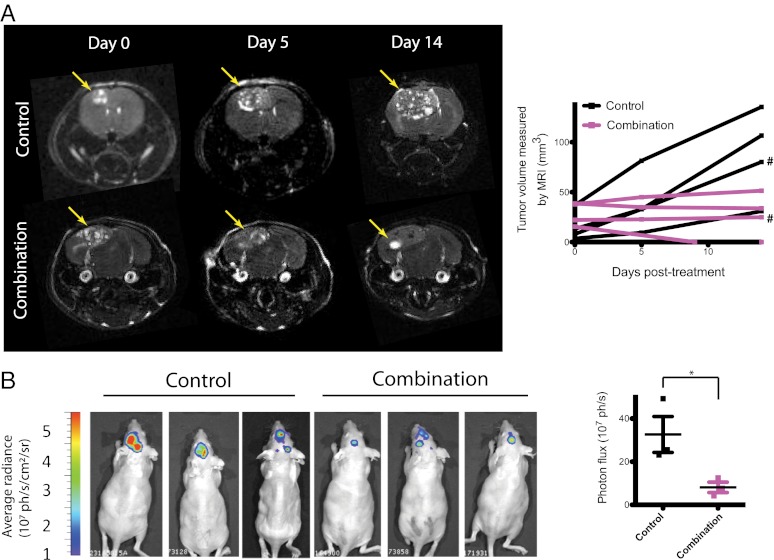
Fig. 3.
Imaging of metastatic breast cancer growth in the brain parenchyma and response to the combination of anti-HER2 and anti-VEGFR2 therapy. (A) MRI analysis of control or trastuzumab and DC101 treatment on BT474-Gluc metastatic tumors in the brain. MRI tumor volume was measured on days 0, 5, and 14 of treatment. (Left) Representative MRI of control- and combination-treated tumors is shown. (Right) Tumor volume, calculated using MRI, is plotted for each individual mouse (# corresponds to the tumors illustrated by the MRI scans in A). (B) Bioluminescence imaging analysis of control or trastuzumab and DC101 treatment on metastatic BT474-Gluc tumors in the brain. (Left) Images of control- and combination-treated tumors 14 d after treatment initiation are shown. (Right) Average bioluminescence signal for the three control- and three combination-treated tumors is depicted. *P < 0.05.

