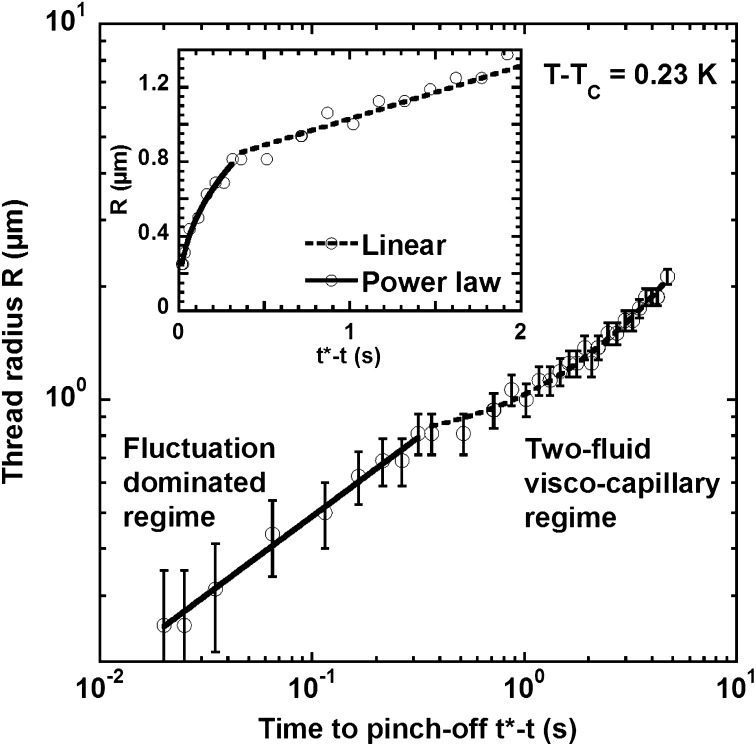
Fig. 2.
Log-log plot of the time variation of the neck thinning up to break-up at  . (Inset) A linear plot with duration of the linear regime, which has been deliberately reduced to highlight the transition toward a power law behavior. The viscocapillary and the fluctuation-dominated regimes are fit respectively to a linear function and a power law with exponent forced at 0.42. The error bars correspond to a measurement error of
  on the diameter.

