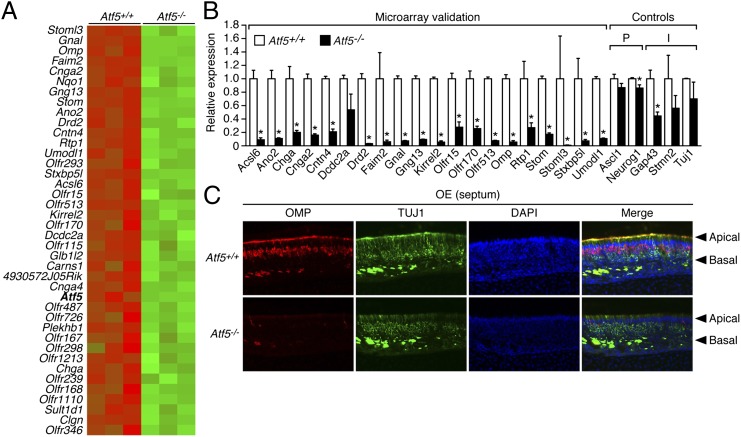
Fig. 4.
ATF5 is required for terminal differentiation of OSNs. (A) Heat map displaying the 40 genes whose expression levels were most decreased in Atf5−/− OE (green) relative to that in Atf5+/+ OE (red). (B) qRT-PCR monitoring gene expression in OE of P0 Atf5+/+ and Atf5−/− mice. The results were normalized to the expression level in Atf5+/+ mice, which was set to 1. P, progenitor markers; I, immature OSN markers. *P < 0.05. (C) Immunofluorescence monitoring OMP (red) and TUJ1 (green) staining in OE (from the septum) of P0 Atf5+/+ and Atf5−/− mice. Sections were counterstained with DAPI (blue). Merged images are shown on the Right. Arrowheads indicate the apical and basal layers of the OE. Magnification 200×.

