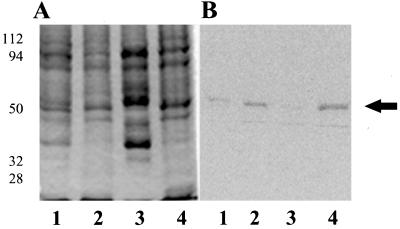
Figure 6.
The recovery of [14C]et-eEF-1A in the 40,000g microsomal pellet and supernatant was compared using cytoskeleton isolation buffer or regular buffer as described in Methods. A, 40,000g supernatant and microsomal pellet fractions from two different homogenizing buffers separated on 10% SDS-PAGE and visualized with Coomassie brilliant blue staining. Lanes 1and 2, Homogenizing with regular buffer: lane 1, supernatant; lane 2, microsomes. Lanes 3 and 4, Homogenizing with cytoskeleton isolation buffer: lane 3, supernatant; lane 4, microsomes. B, Image of the gel in A using a phosphor imager tritium screen exposed for 4 d. The experiment was repeated two times with duplicates. The arrow indicates the migration of the 50-kD standard.

