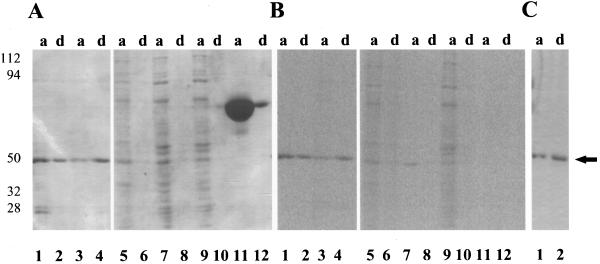
Figure 8.
Purified [14C]et-eEF-1A, purified [14C]myristate eEF-1A, 40,000g microsomal proteins, BSA, and tomato reEF-1A (15 μg) were partitioned into the aqueous (a) and detergent-rich (d) phase as described in Methods. A, Aqueous and detergent-rich fractions were separated by 10% SDS-PAGE and visualized by Coomassie brilliant blue staining. Lanes 1 and 2, [14C]et-eEF-1A; lanes 3 and 4, [14C]myristic acid eEF-1A; lanes 5 and 6, [14C]myristic acid-labeled 40,000g microsomal pellet; lanes 7 and 8, [14C]ethanolamine-labeled 40,000g supernatant; lanes 9 and 10, [14C]myristic acid-labeled 40,000g supernatant; and lanes 11 and 12, BSA. B, Image of the gel in A using a tritium phosphor imager screen exposed for 4 weeks. C, Tomato reEF-1A visualized by staining with Coomassie brilliant blue staining. Lane 1, Aqueous phase; and lane 2, detergent-rich phase. The experiment was repeated two times with duplicates. A representative experiment is shown. The arrow indicates the migration of the 50-kD standard.

