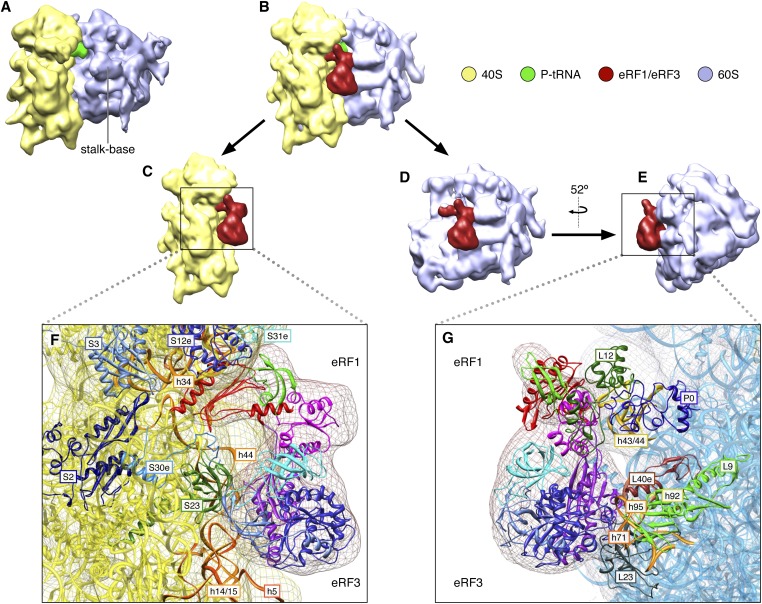
Fig. 1.
Structures of 80S–P-tRNA and 80S–P-tRNA–eRF1–eRF3–GMPPNP complexes. (A) Cryo-EM map of 80S–P-tRNA. (B) Cryo-EM map of the 80S–P-tRNA–eRF1–eRF3–GMPPNP complex. (C) The 60S portion removed from B to show 40S subunit’s interactions with the eRF1–eRF3–GMPPNP ternary complex. (D) The 40S portion removed from B to show 60S subunit’s interaction with the eRF1–eRF3–GMPPNP ternary complex. (E) Map shown in D rotated clockwise by 52°. (F) Detailed interactions between 40S rps and rRNA with individual domains of eRF1 and eRF3 (see Fig. 2A for the domain color scheme), inferred by fitting atomic structures into the density. Structure of 40S subunit (boxed portion in C) is shown as yellow ribbon. Proteins surrounding eRF1–eRF3 are shown as individually colored ribbon. (G) Detailed interactions between 60S rps and rRNA with individual domains of eRF1 and eRF3. Structure of 60S in boxed region as shown in E is displayed as blue ribbon. Large subunit proteins surrounding eRF1–eRF3 are shown as individually colored ribbons. In both F and G, individual domains of eRF1 and eRF3 are colored separately and the cryo-EM density is displayed in mesh.

