
Fig. 5.

The van’t Hoff plots of the temperature dependence of the equilibrium constant are very sensitive to a particular interaction responsible for the depth of potential wells shown in Fig. 4. The dash-dotted line shows 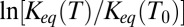 calculated according to Eq. 12 with the temperature-independent potential well depth
  = 13
= 13  using
using  = 20 °C as the reference temperature, indicated by the vertical dashed line. In the case of Coulomb interactions, the temperature dependence of the dielectric constant may significantly compensate the van’t Hoff slope and even lead to its inversion, staying approximately linear in this temperature range. This is illustrated by the solid curve calculated according to Eqs. 15–17, as explained in the text. Temperature dependence of van der Waals (vdW) forces may induce slope corrections in the same direction, whereas in the case of hydrogen bonding the slope of the temperature dependence is expected to increase (arrows around the dash-dotted line).