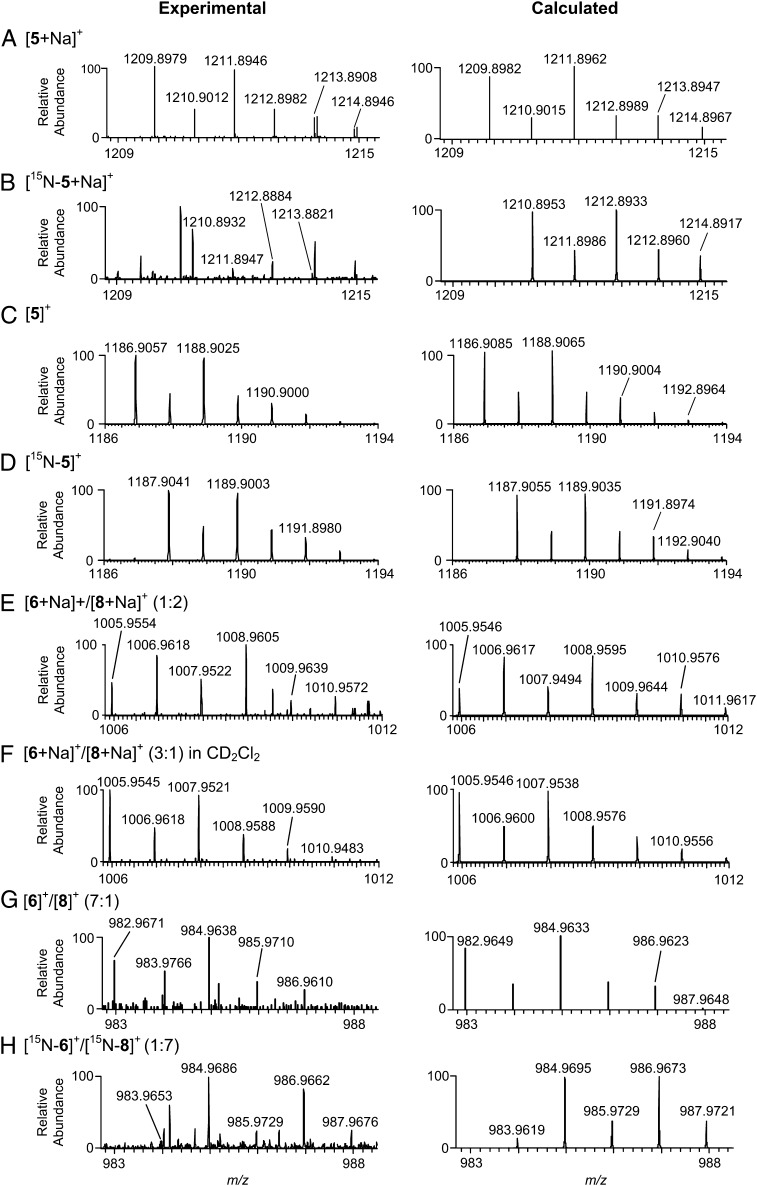
Fig. 4.
Experimental and calculated mass spectral isotope profiles. A and C show spectra for [5+Na]+ and [5]+ produced using ROSO214NH2; corresponding spectra using ROSO215NH2 are shown in B and D. E and G show spectra for the overlapping isotope distributions of [6+Na]+/[8+Na]+ (calculated ratio of 1:2) and [6]+/[8]+ (calculated ratio of 7:1) for ROSO214NH2. F shows overlapping signals of [6+Na]+/[8+Na]+ in CD2Cl2 (calculated [6+Na]+ to [8+Na]+ ratio of 3:1). H shows overlapping signals from [6]+ and [8]+ (1:7) using ROSO215NH2. Signal intensities for the [6]+/[8]+ distributions (G and H) are very low. Therefore, for clarity, ion signals that were larger than the isotope signals from [6]+/[8]+ were subtracted, and the spectrum was normalized to the most intense signal from [6]+/[8]+. The complete mass spectra for G and H are shown in Fig. S5.

