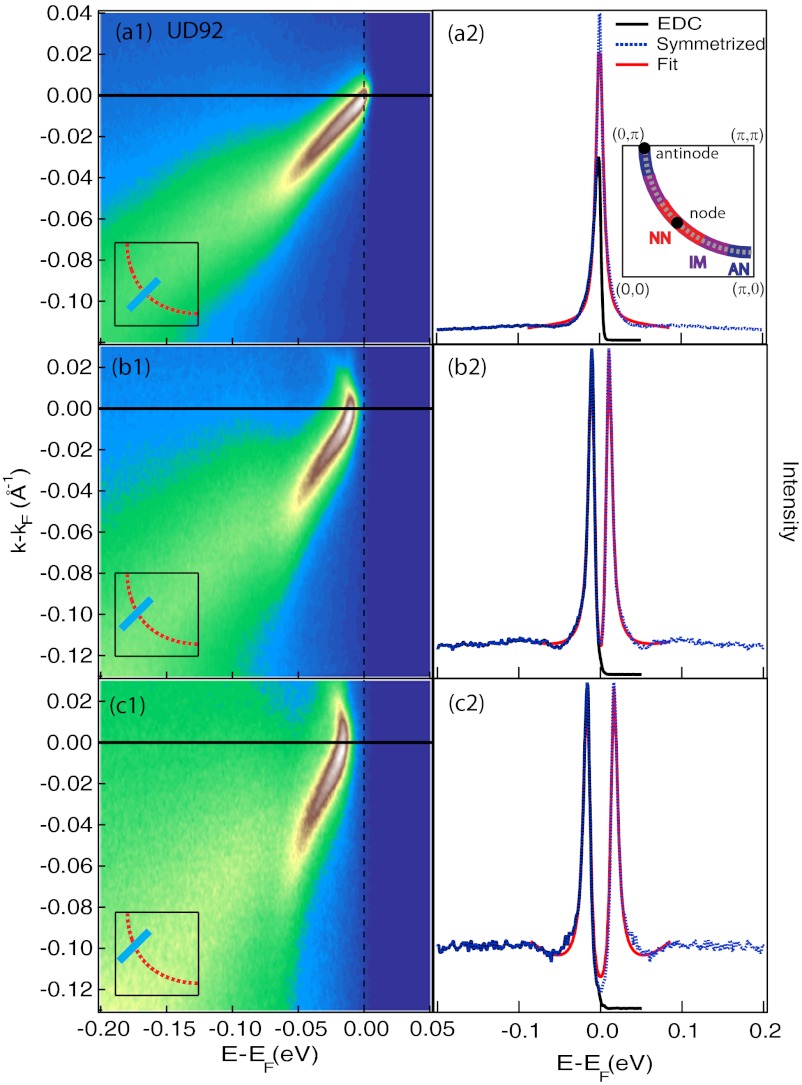
Fig. 1.
Raw data, EDCs, and fitting. (A1, B1, C1) Spectra for UD92 at the node (A1) and away from the node (B1 and C1), with cut geometry and position shown in insets. Horizontal lines are kF. (A2, B2, C2) Raw (black) and symmetrized (blue) EDCs at kF. EDCs are fit to a minimal model (16) (red) to extract gap. (A2, Inset) A quarter of the cuprate Brillouin zone and the FS (dotted line). The node and antinode points are identified with black dots. Locations of NN (red), IM (purple), and AN (blue) momenta are shown.

