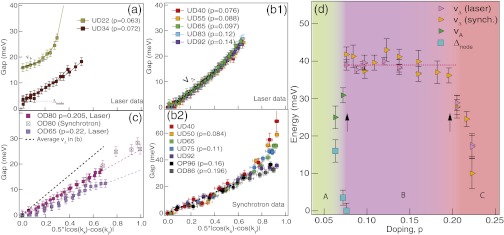
Fig. 2.
Three distinct phase regions at low temperature. Label UD/OP/OD denotes underdoped/optimal/overdoped sample with Tc given by the number which follows. Gaps plotted in terms of the simple d-wave form. vΔ (vA) is from a fit over the linear portion of the gap function, as shown by a solid or dotted line in A or B1, respectively. (A) In region A, FS is fully gapped with gap minimum, Δnode, at nodal momentum. Gap anisotropy vA decreases with underdoping. (B) Region B has doping-independent vΔ. (C) In region C, vΔ decreases as Tc decreases. Dashed line is guide-to-the-eye for average vΔ observed in region B. Error bars in laser-ARPES reflect 3σ error in fitting procedure and an additional 100% margin. Error bars in synchrotron data reflect uncertainty of determining EF (±0.5 meV), error from fitting procedure, and an additional 100% margin. (D) Summary of low-temperature NN energy scales. Arrows mark critical dopings defining three phase regions.

