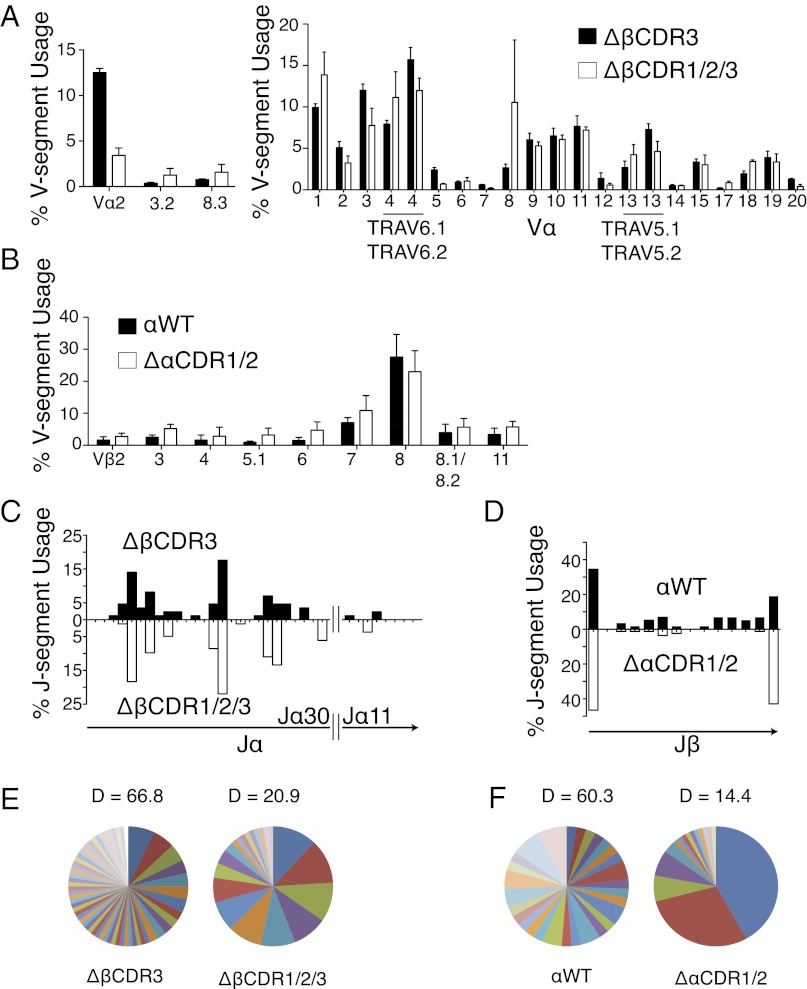
Fig. 4.
Endogenous TCR repertoires coselected with retrogenic WT and mutant α and β TCR chains. (A) Flow cytometric (Left; n = 5) and quantitative RT-PCR (Right; n = 4) analysis of endogenous TCR Vα-segment use by splenic GFP+CD4+ ΔβCDR3 and ΔβCDR1/2/3 retrogenic T cells. TRAV, TCR alpha variable-segment. (B) Flow cytometric analysis of endogenous TCR Vβ-segment use by GFP+CD4+ splenic αWT and ΔαCDR1/2 retrogenic T cells (n = 3). Error bars represent SEM. (C) Analysis of endogenous TCR Jα-segment use by Vα9 recombination events from splenic ΔβCDR3 (n = 83) and ΔβCDR1/2/3 (n = 75) retrogenic CD4 T cells. (D) Analysis of endogenous TCR Jβ-segment use by Vβ7 recombination events from splenic αWT (n = 57) and ΔαCDR1/2 (n = 84) CD8 T cells. (E and F) Analysis of endogenous CDR3 repertoire diversity. Pie charts represent frequencies of CDR3 with unique regions with unique amino acid composition within the recombination events in C and D [Shannon Diversity Index (D) is indicated].

