Fig. 5.
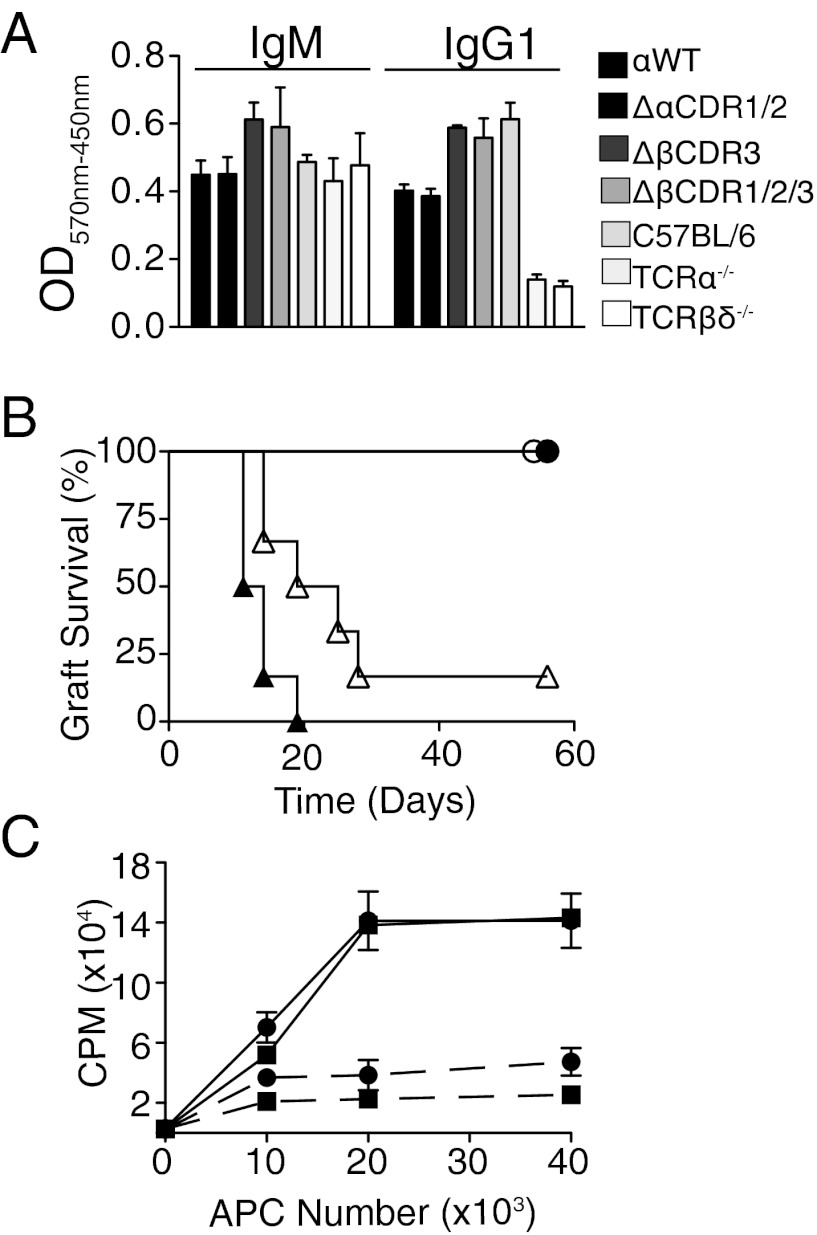
Functional analysis of T cells expressing mutated TCR chains. (A) Mutant germ-line CDR1/2 regions direct Ig class switching. Serum IgM and IgG1 levels of retrogenic mice expressing WT and mutant TCRs are shown. C57BL/6 and nonreconstituted TCR-α−/− TCR-βδ−/− mice were used as positive and negative controls, respectively. Bars represent triplicates from a single mouse. One representative experiment of two is shown. Lanes are identified in the key. (B) TCR-βδ−/− (H2q) mice were adoptively transferred with pooled T cells expressing ΔβCDR3 (filled symbols, n = 7) or ΔβCDR1/2/3 (open symbols, n = 7) and received adjacent allogeneic C57BL/6 (H2b, triangles) and syngeneic (H2q, circles) skin grafts. (C) Mixed lymphocyte response. Purified splenic retrogenic CD4 T cells expressing ΔβCDR3 (●) or ΔβCDR1/2/3 (■) were cultured with activated BMDCs from allogeneic C57BL/6 (H2b, solid lines, n = 3) and syngeneic (H2q, dashed line, n = 3; each in duplicate) donors in the presence of titrated thymidine. Error bars represent SEM. APC, Antigen Presenting Cell, CPM, counts per minute.

