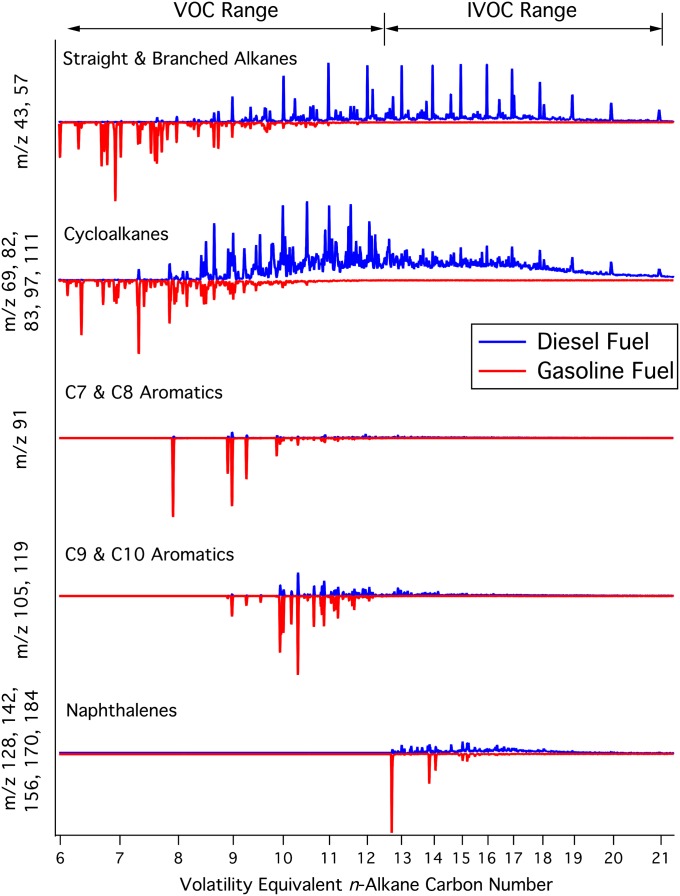
Fig. 1.
Distributions of chemical classes for diesel (blue) and gasoline (red) are distinct with some overlap as shown via GC/MS for representative fuel samples. Fuels span both the VOC and IVOC volatility ranges. Chemical classes are represented by their dominant mass fragments and shown as a function of n-alkane carbon number.

