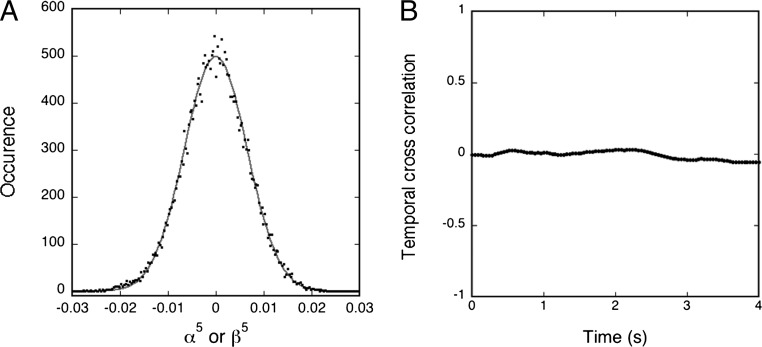
Fig. 1.
For a proteoGUV of DOPC/DOPS/Chol/ATPase, a radius of 12.97 μm in the presence of 1 mM of ATP is shown: (A) Experimental distribution of the Fourier amplitudes of the contour fluctuations; α5 or β5. (B) Plot of the normalized temporal cross-correlation function between modes 5 and 6. Mode 5 has been chosen randomly among the midrange modes (4–10), which have good statistics and are not limited by the video integration time. The solid curve in A is the best fit of the data to a Gaussian.

