
Figure 4. Model of the Intact Monopolin Complex, with Proteins Colored as in Figure 1.
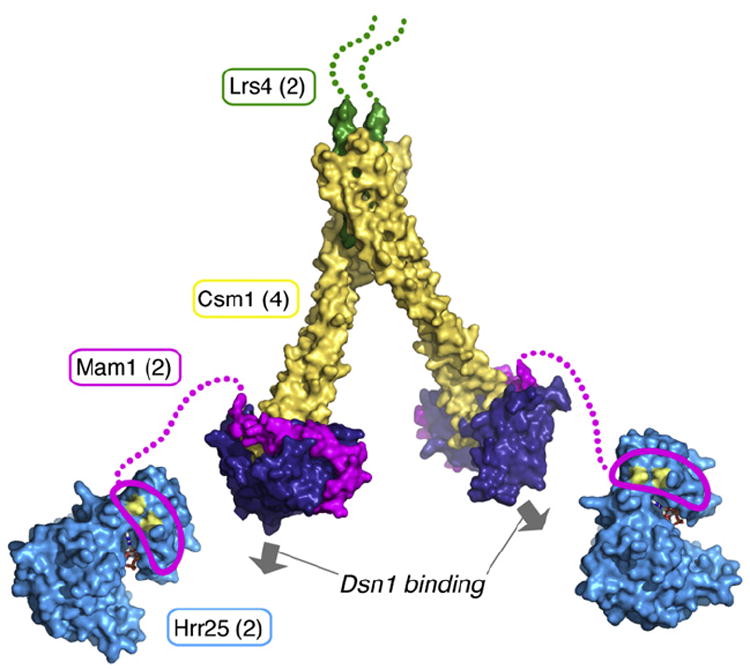
Hrr25 is represented by the structure of S. pombe casein kinase I (Xu et al., 1995), with residues H25 and E34 shown in yellow and bound ATP shown as sticks. The central domain of Mam1 (magenta outline) is shown bound to the N-terminal lobe of Hrr25 (Petronczki et al., 2006), with the linker region (residues 192–220) shown as a dotted magenta line. The copy number of each protein in the complex is indicated in parentheses, and the two available Dsn1-binding sites are indicated by arrows.