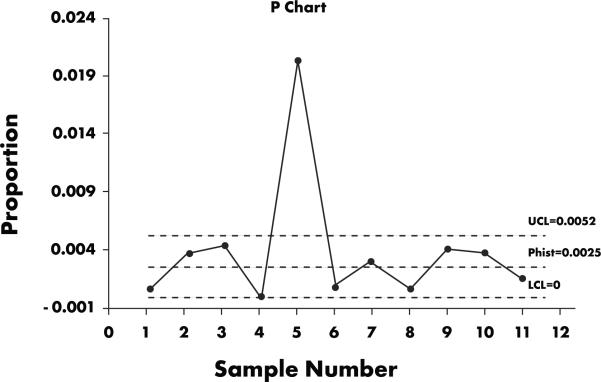
Figure 1.
Chart created as part of DCRI statistical process control methodology. The DCRI project team typically addresses any outliers that appear above the upper control limit (UCL). In the case illustrated here, the outlier above the UCL was deemed to be due to inadequate training in a data processing convention.

