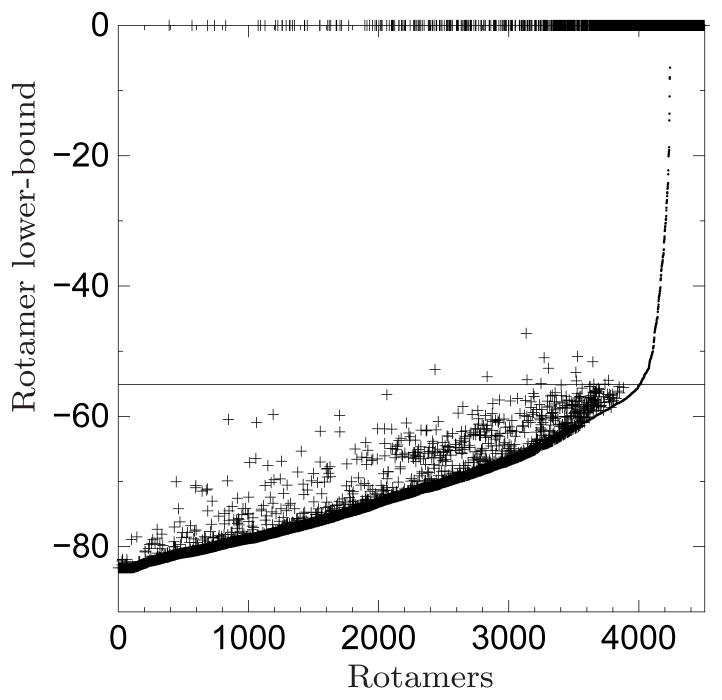
Figure 11.
Plots of TRMP lower bound vs. rotamer, for all (4,504) rotamers in the subproblem of node 2 in solving Case 17 by BroMAP; rotlb1 is represented by a dot and rotlb2 by a ‘+’ symbol. Rotamers are sorted on x-axis by the increasing order of rotlb1. All rotamers with lower bounds greater than or equal to 0 were clipped at y = 0. The horizontal line at y = −55.13 represents U. By comparing rotlb1 against U, 497 rotamers (4, 008th to 4, 504th in the order) were eliminated. Using rotlb2 instead increased the number of eliminated rotamers to 1,171.

