
Figure 5.
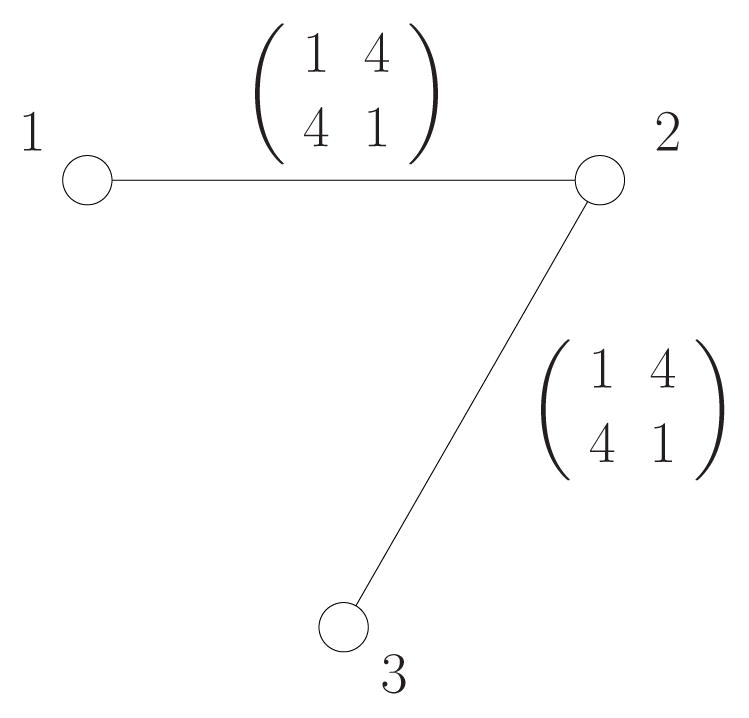
The diagram shows the graphical model and pairwise compatibility functions ψ12(x1, x2) and ψ23(x2, x3) of the distribution used in Example 3.
Official websites use .gov
A
.gov website belongs to an official
government organization in the United States.
Secure .gov websites use HTTPS
A lock (
) or https:// means you've safely
connected to the .gov website. Share sensitive
information only on official, secure websites.
The diagram shows the graphical model and pairwise compatibility functions ψ12(x1, x2) and ψ23(x2, x3) of the distribution used in Example 3.