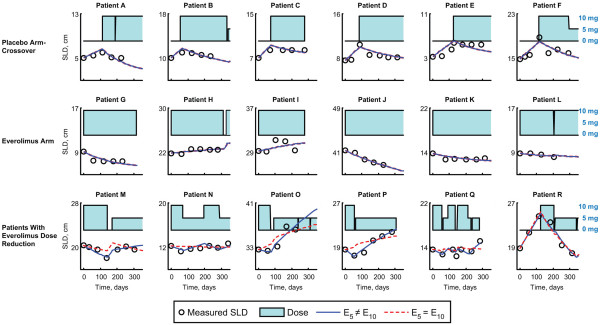
Figure 1 .
Change in sum of the longest tumor diameters (SLD) over time in representative patients in relation to everolimus treatment. Three treatment groups are shown: 1) patients randomized to placebo who crossed over to everolimus on disease progression; 2) patients randomized to everolimus; and 3) patients randomized to everolimus or placebo who had at least one everolimus dose reduction from 10 mg to 5 mg daily. Two different fits of the SLD over time are illustrated for each patient, based on: i) a model that assumes E5 = E10 (model 1, shown in the red dashed line) and ii) a model that assumes E5 ≠ E10 (model 2, shown in the blue solid line). Daily dose of everolimus administered is indicated by a barplot as a function of time with a value of 10 mg at its maximum. E5, treatment effect of everolimus 5 mg daily; E10, treatment effect of everolimus 10 mg daily.

