
Figure 4 .
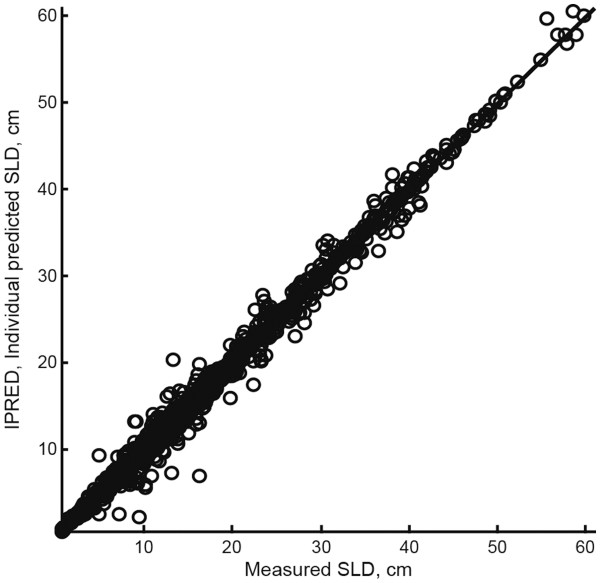
Correlation of the individual predictions of SLD by the model in which E 5 ≠ E 10 (model 2) to the actual measured SLD from each patient. E5, treatment effect of everolimus 5 mg daily; E10, treatment effect of everolimus 10 mg daily; SLD, sum of the longest tumor diameters.