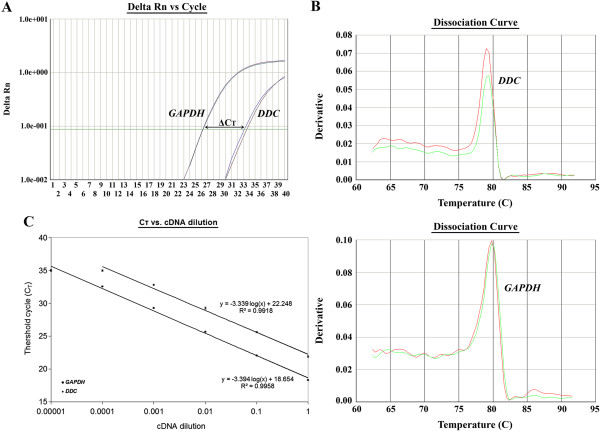
Figure 1.
Relative quantification of DDC mRNA expression in a laryngeal squamous cell carcinoma specimen, using qRT-PCR. (A) Amplification plots of DDC and GAPDH cDNAs, (B) dissociation curves of the respective amplicons, showing dRn plotted against cycle number, and (C) validation of the comparative Ct (2-ddCt) method, to evaluate the efficiency of DDC and GAPDH amplification.

