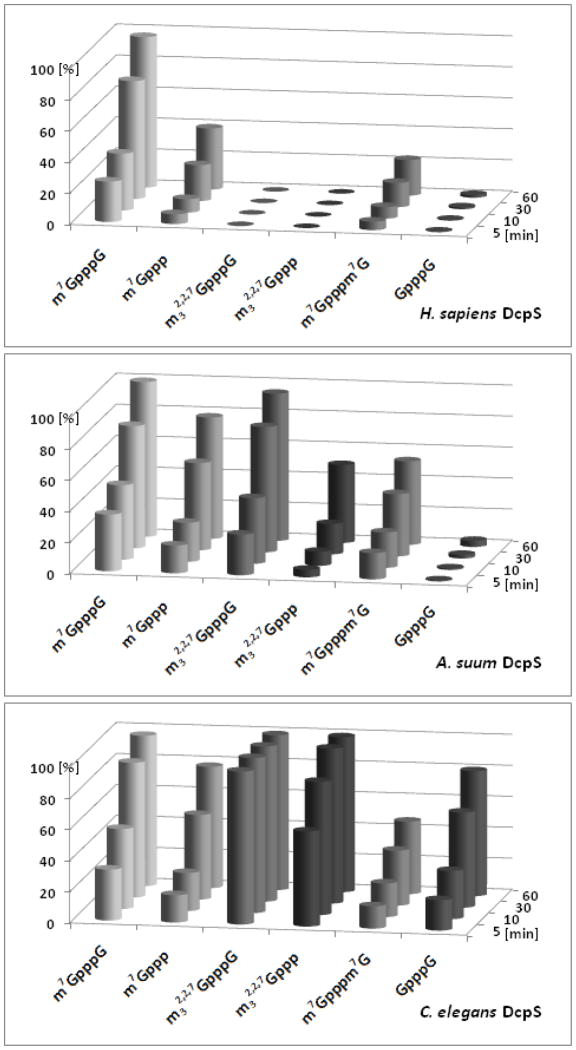
Figure 3.
Comparison of the hydrolytic activity of HsDcpS, AsDcpS and CeDcpS. The extent of decapping (x) was determined as the % of hydrolyzed substrate measured by HPLC system. The standard deviation of the mean x value is below 5%. All experiments were performed at 20 °C in 50 mM Tris HCl buffer containing 200 mM KCl, 0.5 mM EDTA and 1 mM DTT (final pH 7.6) with 0.02 μM DcpS. Initial concentrations of cap analogs were 15 μM.

