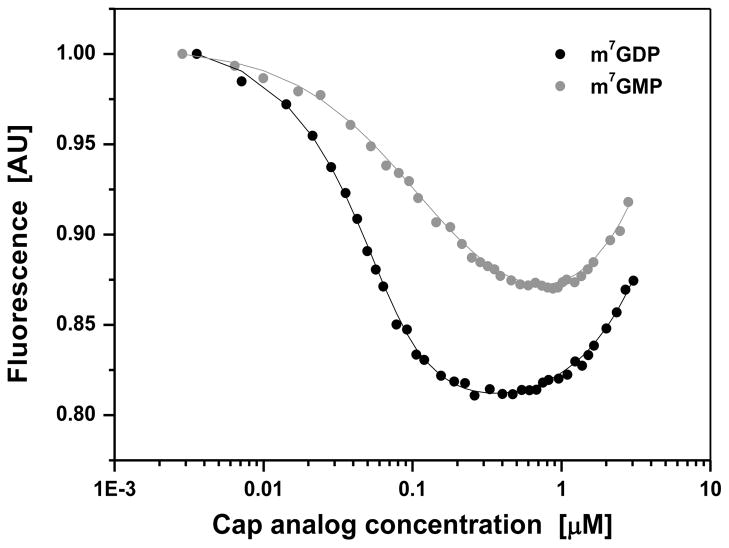
Figure 4.
Fluorescence titration curves for binding of mononucleotide cap analogs to C. elegans DcpS. Titration experiments were carried out at 20 °C, in 50 mM Tris HCl containing 200 mM KCl, 0.5 mM EDTA and 1 mM DTT (final pH 7.6). Protein fluorescence was excited at 280 nm and observed at 340 nm. The intensity of fluorescence is represented as relative values (AU: arbitrary units). The observed increasing fluorescence signal at the higher concentration of cap analogs originates from their emission in free forms present in solutions. The shift of the titration curve for m7GMP towards the higher concentrations, compared to the curve for m7GDP, indicates weaker binding of m7GMP by C. elegans DcpS.

