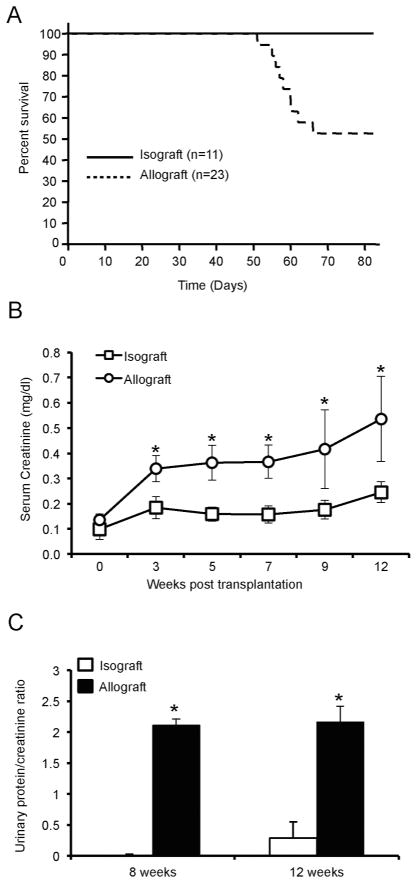
Figure 1. Survival and renal function in allograft and isograft recipients.
(A) Survival rate was monitored after transplantation for 12 weeks. (B) Serum was separated from blood that was collected via retro-orbital puncture and serum creatinine was determined by LC-MS/MS at the indicated time points. (n=7/group, *P < 0.05). (C) Urine was collected at the time of sacrifice and urinary albumin and creatinine were determined. Data are represented as urinary albumin/creatinine ratio. (n=7/group, *P < 0.01).

