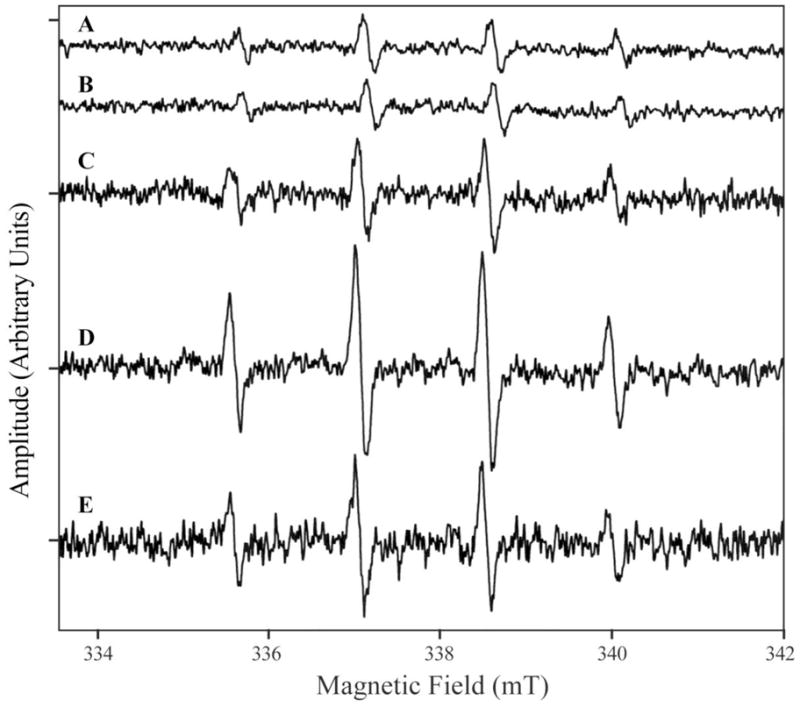
Figure 5.

EPR spectra of DMPO/OH formed in the solution of H2O2 and DMPO. All measurements were carried out at 25°C in 50 mM 3,3-dimethylglutarate pH 6.0 and 88 mM DMPO with either 1 mM EDTA and no H2O2 (trace A); no EDTA and no H2O2 (trace B); 1 mM EDTA and 100 μM H2O2 (trace C); or no EDTA and 100 μM H2O2 (trace D). Trace E is the difference spectrum between trace D and C.
